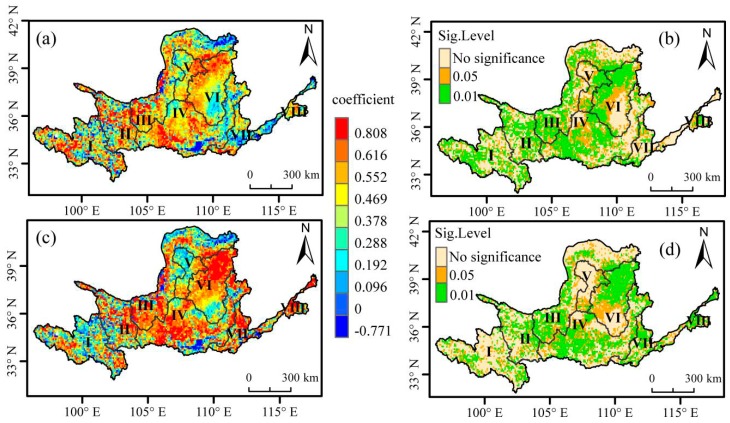
Figure 4.
Spatial patterns of the correlations between Normalized Difference Vegetation Index (NDVI) and Tmax or Tmin during the growing season (April–October) in the Yellow River Basin, 1982–2015. (a) Mapping of the partial correlation coefficients between NDVI and Tmax, given that the corresponding Tmin and precipitation are controlled for in the calculation. (b) Spatial distribution of significance level of the partial correlation coefficients between NDVI and Tmax. (c) The partial correlation coefficients between NDVI and Tmin by controlling Tmax and precipitation. (d) Spatial distribution of partial correlation coefficients between NDVI and Tmin.(I: Longyangxia in the upper reaches; II: Longyangxia to Lanzhou; III: Lanzhou to Hekou town; IV: Longmen to Sanmenxia; V: Inflow zone; VI: Hekou town to Longmen area; VII: Longmen to Huayuankou; VIII: below Huayuankou in the lower reaches).

