Table 4.
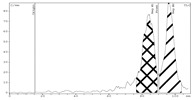
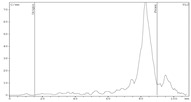
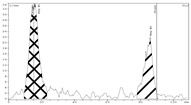
Relation between chromatographic behavior of [89Zr]Zr-oxalate preparations and their biodistribution evaluated using ex vivo direct radiometry.
| Method |
[89Zr]Zr-Oxalate
Sample 1 |
[89Zr]Zr-Oxalate
Sample 2 |
[89Zr]Zr-Oxalate
Sample 3 |
|||
| pH 5.5 | pH 7.0 | pH 9.0 | ||||
| Chromatography (Radio-TLC) | ||||||
| iTLC-SG/50 mM DTPA (pH 7.0) Method 1 |

|

|

|
|||
| RCP ~ 100% | RCP ~ 0% | RCP ~ 0% | ||||
| iTLC-SG/CH3OH-H2O (1:1), 4% TFA (v/v) Method 2 |

|

|

|
|||
| RCP ~ 100% | RCP ~ 100% | RCP < 30% | ||||
| Biodistribution (ID/g, %) | ||||||
| Organ/Tissue | Time after Intravenous Administration | |||||
| 1 h | 24 h | 1 h | 24 h | 1 h | 24 h | |
| blood | 3.57 ± 0.61 | 2.19 ± 0.30 | 3.36 ± 0.60 | 2.15 ± 0.19 | 0.99 ± 0.12 | 0.13 ± 0.02 |
| lungs | 1.22 ± 0.29 | 1.14 ± 0.19 | 1.54 ± 0.35 | 1.12 ± 0.09 | 1.05 ± 0.30 | 0.17 ± 0.08 |
| heart | 1.70 ± 0.16 | 1.09 ± 0.14 | 1.42 ± 0.39 | 1.06 ± 0.11 | 0.05 ± 0.01 | 0.11 ± 0.03 |
| stomach | 0.47 ± 0.16 | 0.30 ± 0.05 | 0.39 ± 0.01 | 0.25 ± 0.02 | 0.27 ± 0.07 | 0.04 ± 0.01 |
| liver | 0.68 ± 0.20 | 0.93 ± 0.05 | 0.77 ± 0.19 | 0.88 ± 0.07 | 5.12 ± 1.81 | 4.88 ± 1.07 |
| kidney | 0.59 ± 0.11 | 1.52 ± 0.24 | 0.65 ± 0.16 | 1.19 ± 0.82 | 0.27 ± 0.11 | 0.60 ± 0.29 |
| bladder | 0.21 ± 0.01 | 0.32 ± 0.17 | 0.34 ± 0.11 | 0.48 ± 0.22 | 0.11 ± 0.06 | 0.06 ± 0.02 |
| s. intestine | 0.47 ± 0.02 | 0.42 ± 0.07 | 0.52 ± 0.15 | 0.39 ± 0.06 | 0.22 ± 0.07 | 0.06 ± 0.02 |
| l. intestine | 0.18 ± 0.01 | 0.55 ± 0.14 | 0.22 ± 0.15 | 0.38 ± 0.11 | 0.06 ± 0.03 | 0.10 ± 0.01 |
| muscle | 0.11 ± 0.05 | 0.11 ± 0.01 | 0.22 ± 0.03 | 0.14 ± 0.03 | 0.05 ± 0.01 | 0.02 ± 0.01 |
| femur | 0.26 ± 0.08 | 0.95 ± 0.25 | 0.37 ± 0.27 | 0.97 ± 0.17 | 0.14 ± 0.02 | 0.27 ± 0.04 |
