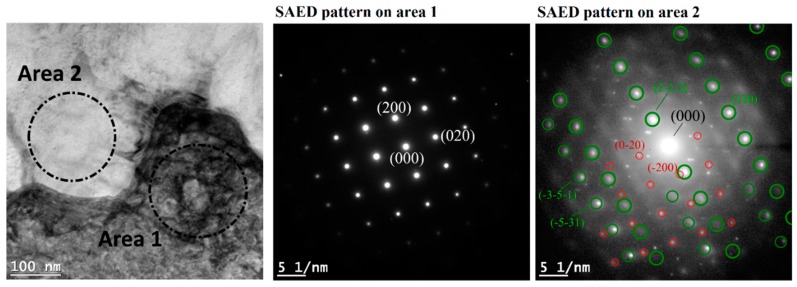
Figure 17.
Transmission electron microscope (TEM) image showing the interface between γ phase (dark contrast) and an interdendritic precipitate (bright contrast) with respective selected area electron diffraction (SAED) patterns, both taken along the [001] zone axis of the γ phase. On the SAED pattern on area 2, the green circles underline diffraction points of Laves phase along its zone axis, instead red circles underline diffraction points of the γ phase.

