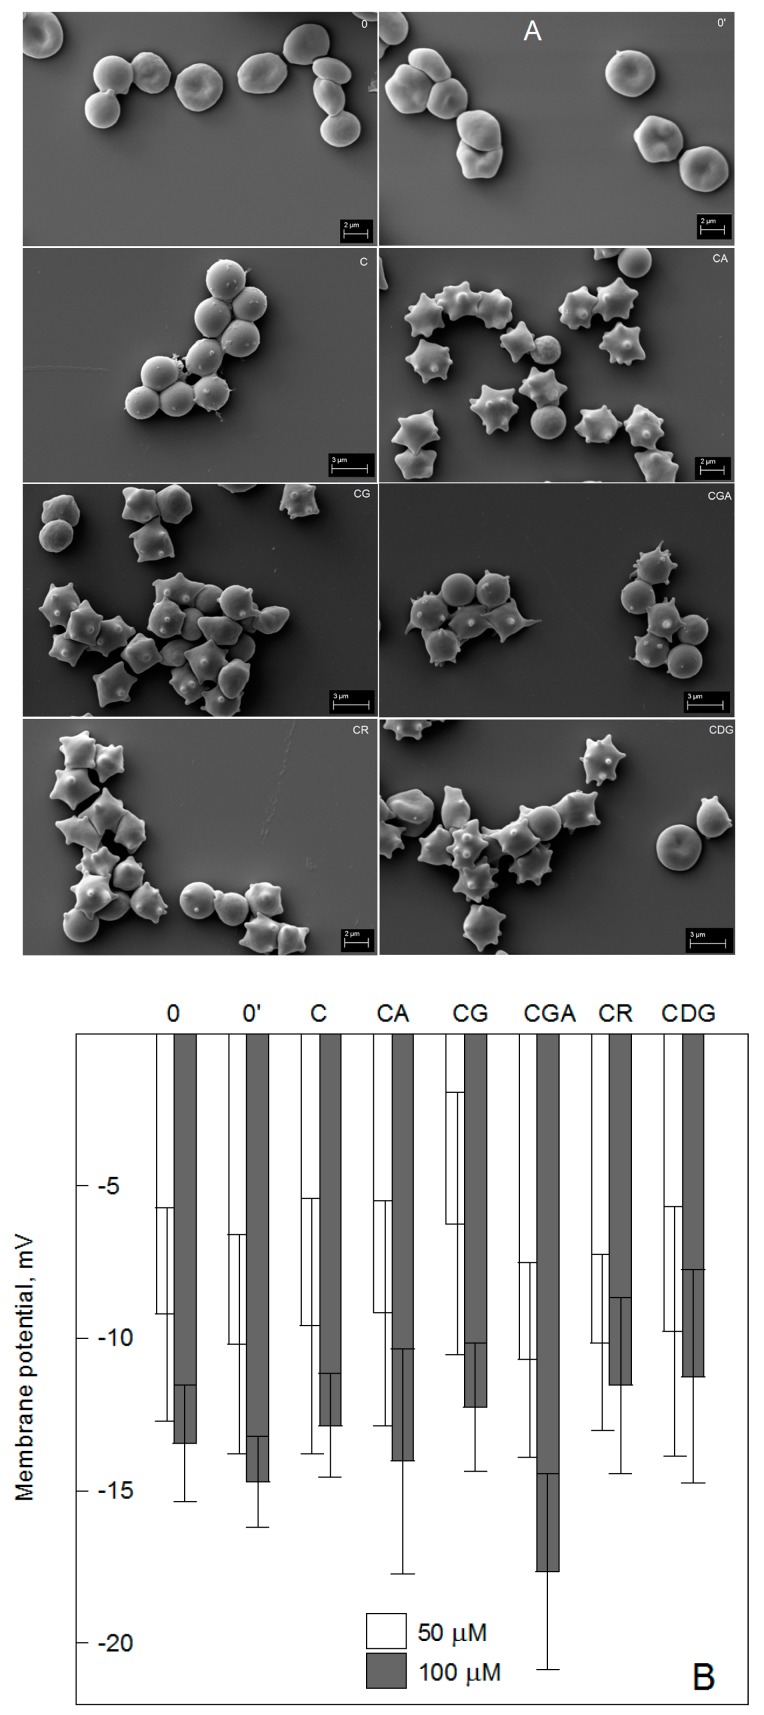
Figure 4.
Representative photos of red blood cells treated with 100 µM of the compounds for 1 h (A). The red blood cells (RBC) photos were obtained using a scanning electron microscope and the experiment was performed three times. (B) The impact of the compounds on the transmembrane potential of erythrocytes was calculated with the Nernst equation. Values of the membrane potential are means ± SD (n = 3) of triplicate experiments. The RBCs were modified by 50 and 100 µM of the compounds. Cyanidin (C), cyanidin-3-O-arabinoside (CA), cyanidin-3-O-glucoside (CG), cyanidin-3-O-galactoside (CGA), cyanidin-3-O-rutinoside (CR), cyanidin-3-5-O-diglucoside (CDG) treated cells, control (0), and solvent control (0′).

