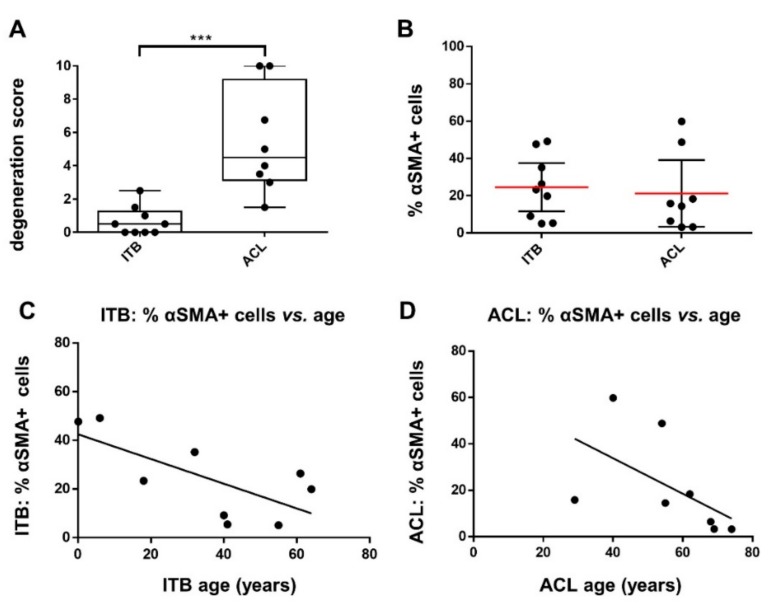
Figure 3.
The degree of degeneration and the percentage of αSMA-positive cells as well as age vs. percentage of αSMA-positive cells in ITB and ACL. (A) The differences in the degeneration scoring results and (B) the percentage of αSMA-positive cells. The correlation between the percentage of αSMA-positive cells in ITB (C) and ACL tissue samples (D) and donor age. Figure 1A: *** p = 0.0002, Mann–Whitney test; Figure 1B: no significant difference; Figure 1C: significant negative correlation (p = 0.035), pearson, r = −0.703; (D): not significant, pearson, r = −0.552, p = 0.156.

