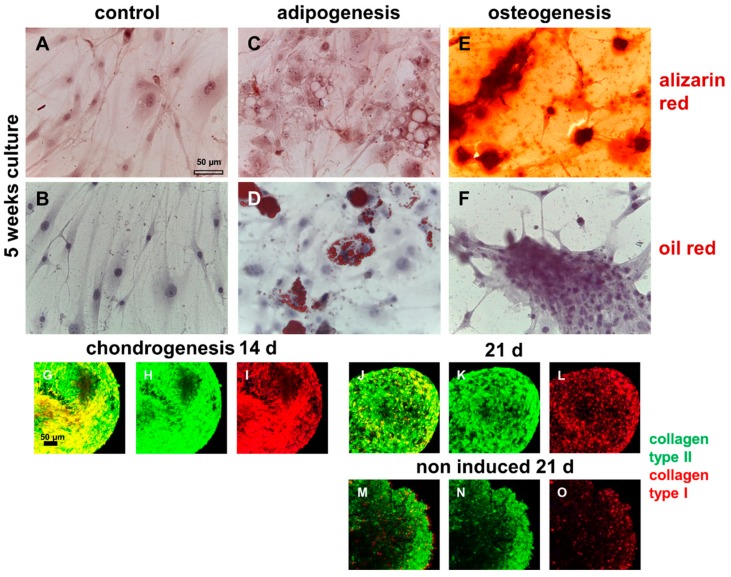
Figure 8.
The multilineage differentiation potential of isolated migrative ITB cells. (A,C,E) Alizarin red staining. (B,D,F) Oil red staining. A,B: Non-induced control. C,D: Adipogenically induced. E,F: Osteogenically induced. Chondrogenically induced for 14 d (G–I) or 21 d (J–L) and noninduced for 21 d (M–O). G,J,M: Merged (collagen type I: red, collagen type II: green); H,K,N: collagen type II (green); I,L,O: collagen type I (red). Scale bars: 50 µm. ITB, iliotibial band.

