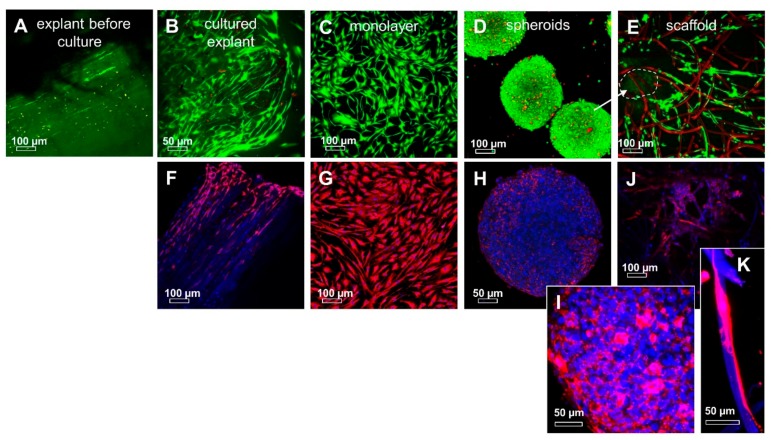
Figure 9.
The vitality and αSMA immunoreactivity of ITB tissue and 2-D and 3-D cultured ITB fibroblasts. (A) Freshly prepared explant (before cultured); (B) explant after 109 days of culturing; (C) monolayer, P0; (D) mini spheroids consisting of 25.000 ITB cells after 3 days of spheroid formation; and (E) polyglycolic acid (PGA) scaffold colonized by ITB fibroblasts for 7 days. ITB cells emigrated from spheroids placed on the scaffold (E): the arrow and dashed line mark the position of the former spheroid) and spread on the fibers. Vital cells: green, dead cells or scaffold fibers: red. The αSMA immunoreactivity (red) is shown (F) in an explant after 109 days of culturing; (G) monolayer, P0; (H) mini spheroids consisting of 25.000 ITB cells after 2 days of spheroid formation ((I) zoomed); (J) PGA scaffold colonized by ITB fibroblasts for 3 days; (K) zoomed inset. αSMA immunoreactive cells: red. Cell nuclei: blue. Some degrading fibers stain also blue. Scale bars: 100 µm (A–G, J) and 50 µm (H,I,K).

