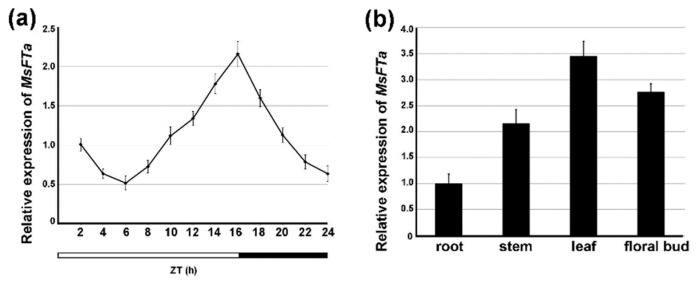
Figure 5.
Diurnal and tissue-specific expression of MsFTa. (a) The expression level of MsFTa transcript during 24 h zeitgeber time (ZT) under LD. The white bar represents day time and the black bar represents night. (b) Relative expression of MsFTa in roots, stems, leaves and flowers of alfalfa at ZT 14. Bars represent the means ± SD of three biological replicates.

