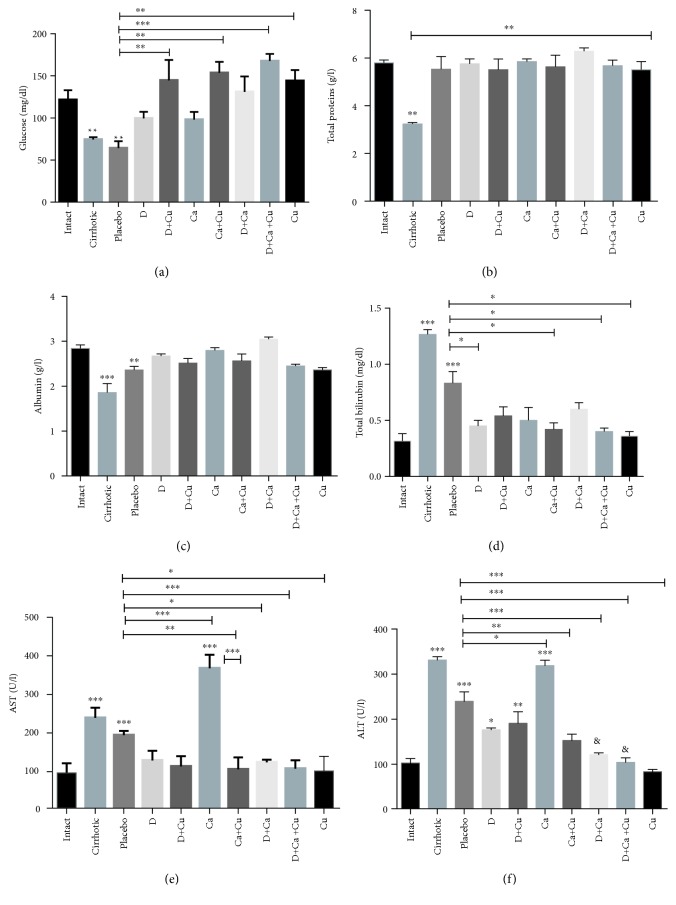
Figure 6.
Evaluation of liver function in cirrhotic hamster treated with α/β-AR antagonists and curcumin. The serum levels of (a) glucose, (b) total proteins, (c) albumin, (d) total bilirubin, (e) AST, and (f) ALT were used as markers of liver damage. The healthy livers (intact group), the livers from animals with cirrhosis induced (cirrhotic group) and, after the cirrhosis, treated with water (Placebo), doxazosin (D), carvedilol (Ca), curcumin (Cu), doxazosin and carvedilol (D+Ca), doxazosin and curcumin (D+Cu), carvedilol and curcumin (Ca+Cu), and the combination of doxazosin, carvedilol, and curcumin (D+Ca+Cu). Data is presented as mean ± SEM (n = 5 each group). In glucose: D+Cu, Ca+Cu, D+Ca+Cu, and Cu groups vs. placebo, ∗∗p < 0.01 and ∗∗∗p < 0.001. In total proteins: mean values vs. cirrhotic and cirrhotic vs intact, ∗∗p < 0.01. In albumin: mean values vs. intact, ∗∗p < 0.01 and ∗∗∗p < 0.001. In total bilirubin: cirrhotic and placebo vs. intact: ∗∗∗p < 0.001. D, Ca+Cu, D+Ca+Cu, and Cu vs. placebo, ∗p < 0.05. In AST: cirrhotic, placebo, and Ca vs. intact, ∗∗∗p < 0.001. Ca, Ca+Cu, D+Ca, D+Ca+Cu, and Cu vs. placebo, ∗p < 0.05, ∗∗p < 0.01, and ∗∗∗p < 0.001. Ca+Cu vs. Ca, ∗∗∗p < 0.001. In ALT: cirrhotic, placebo, D, D+Cu, and Ca vs. intact, p < 0.05, ∗∗p < 0.01, and ∗∗∗p < 0.001. Ca, Ca+Cu, D+Ca, D+Ca+Cu, and Cu vs. placebo, p < 0.05, ∗∗p < 0.01, and ∗∗∗p < 0.001.

