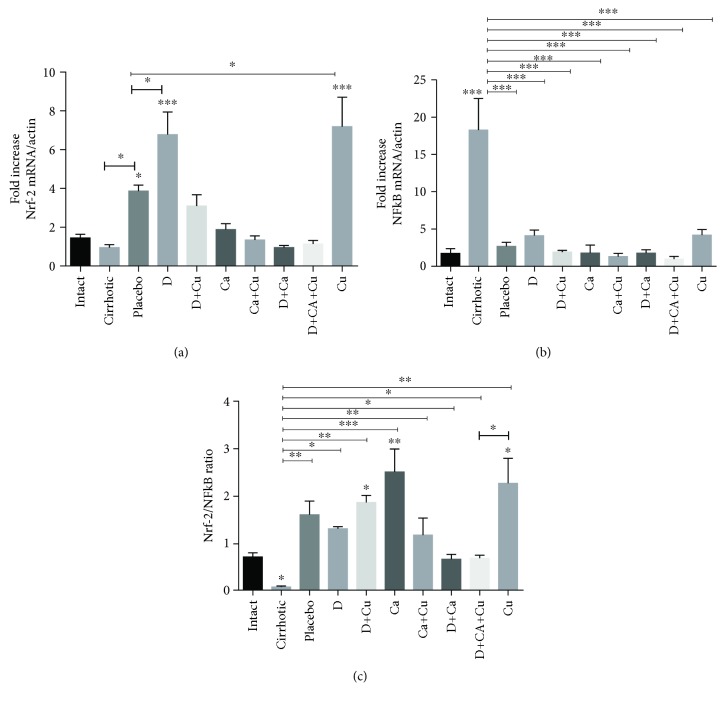
Figure 7.
Evaluation of the effect of α/β-AR antagonists and curcumin on expression of the NF-κB and Nrf-2 in the regression of cirrhosis. (a) Evaluation of the Nrf-2 mRNA. (b) Evaluation of the NF-κB mRNA expression. (c) Evaluation of Nrf-2/NF-κB ratio. The healthy livers (intact group), the livers of animals whit cirrhosis induced (cirrhotic group) and, after the cirrhosis, treated with water (placebo), doxazosin (D), carvedilol (Ca), curcumin (Cu), doxazosin and carvedilol (D+Ca), doxazosin and curcumin (D+Cu), carvedilol and curcumin (Ca+Cu), and the combination of doxazosin, carvedilol, and curcumin (D+Ca+Cu). Data is presented as mean ± SEM (n = 5 each group). In Nrf-2 mRNA/actin: placebo, D, and Cu vs. intact, ∗p < 0.05, ∗∗∗p < 0.001. Placebo vs. cirrhotic and D and Cu vs. placebo, ∗p < 0.05. In NF-κB mRNA/actin: cirrhotic vs. intact, ∗∗∗p < 0.001. Mean values vs. cirrhotic group, ∗∗∗p < 0.001. In Nrf-2/NF-κB ratio: D+Cu, Ca, and Cu vs. intact, ∗p < 0.05, ∗∗p < 0.01. Mean values vs. cirrhotic, ∗p < 0.05, ∗∗p < 0.01, and ∗∗∗p < 0.001. Cu vs. D+Ca+Cu, ∗p < 0.05.

