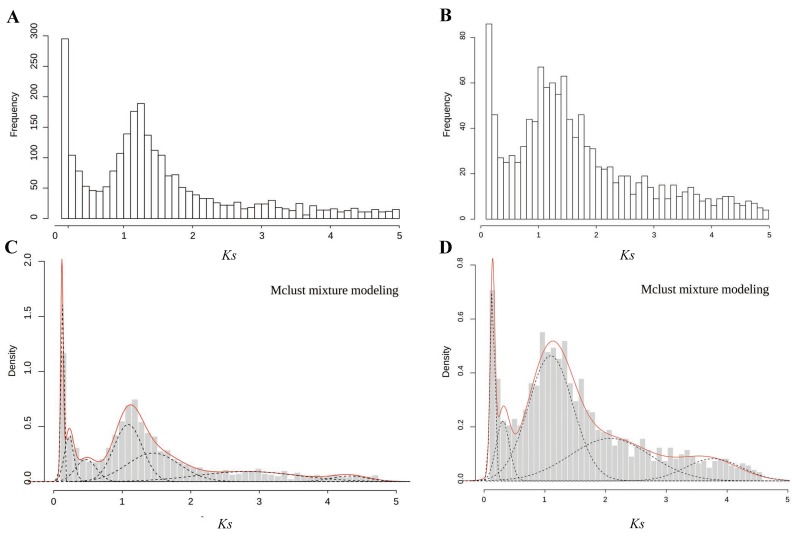
Figure 2.
Frequency distributions of Ks values based on paralogous pairs of C. thalictroides. (A,C) Distributions of Ks values pairs of the diploid and triploid within 5. The x-axis represents the synonymous substitutions with a Ks cutoff of five in bins of 0.1, and the y-axis shows the number of retained duplicated paralogous gene pairs. (B,D) Mclust Gaussian mixture model analysis of (A,C), respectively. Optimal number of log-normal components overlaid on Ks distributions. The red line shows the sum of components.

