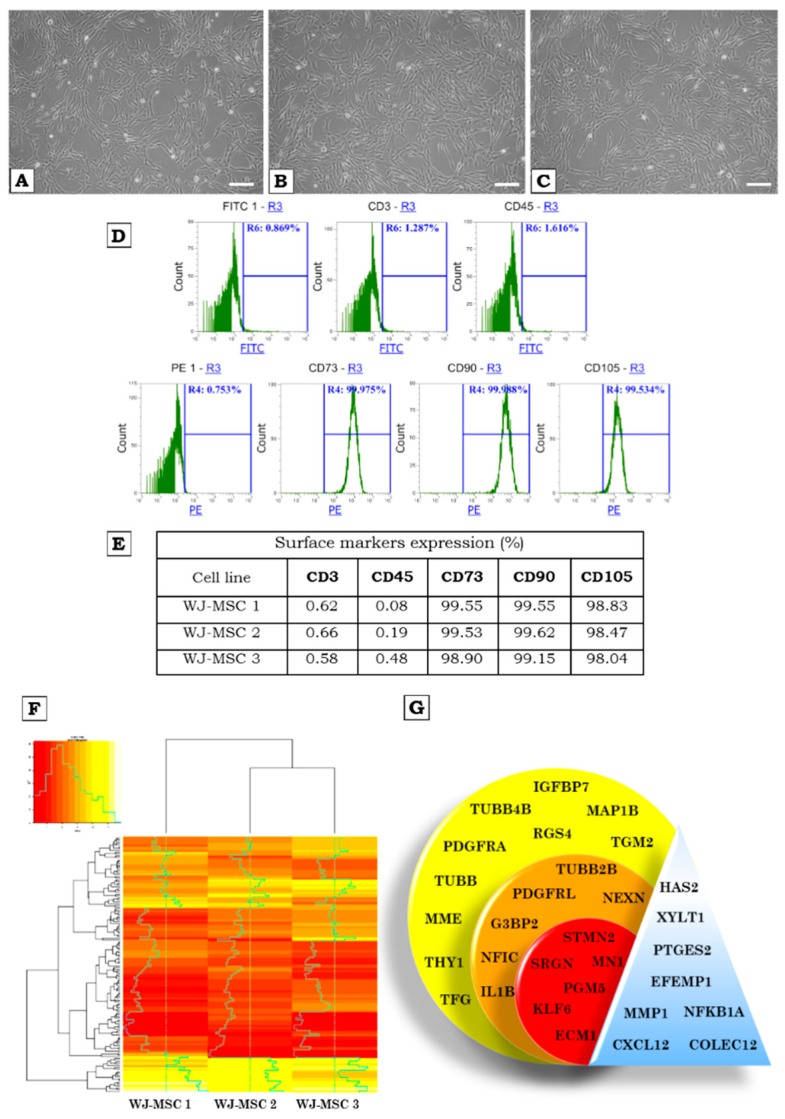
Figure 1.
(A–C)—The cultures of WJ-MSCs, fifth passage. The cells grow in a monolayer, show adherent properties and fibroblast-like morphology; Morphology of cells cultured in (A–C)—normoxia—magnification 100×, white bars correspond to 50 µm. (D)—Flow cytometry analysis of surface markers expression of WJ-MSCs. The WJ-MSCs were labelled with anti-CD3-FITC and anti-CD45-FITC antibodies (negative markers) and anti-CD73-PE, anti-CD90-PE, anti-CD105-PE antibodies (positive markers), and analyzed by flow cytometry. (D)—Representative histograms showing expression of set of markers for WJ-MSCs (detailed analysis presented in the table—(E). (F)—a heatmap showing the transcription profile of investigated WJ-MSCs. (G)—transcripts of selected genes expressed in the WJ-MSCs. The colors of the circles correspond to the colors on the heatmap (F): yellow—high expression; orange—medium expression; red—low expression; triangle—genes with different expression level.

