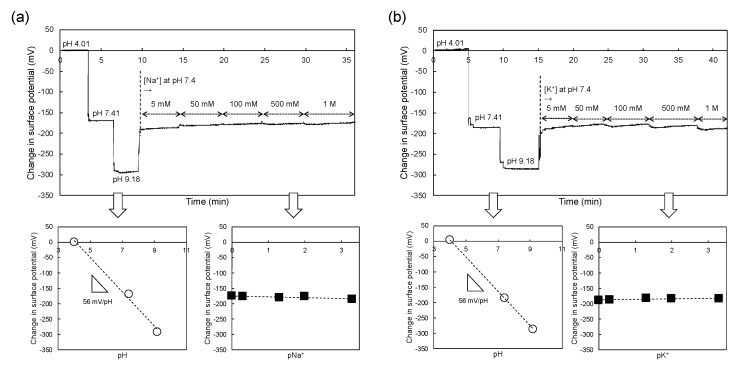
Figure 2.
(a) Change in surface potential with varying pH and Na+ concentration using ISFET sensor. The gate surface potential at a pH of 4.01 was offset to 0 and the change in the potential was measured from a pH of 4.01 to 9.18 and then from a Na+ concentration of 5 mM to 1 M. (b) Change in surface potential with varying pH and K+ concentration using ISFET sensor. The gate surface potential at a pH of 4.01 was offset to 0 and the change in the potential was measured from a pH of 4.01 to 9.18 and then from a K+ concentration of 5 mM to 1 M.

