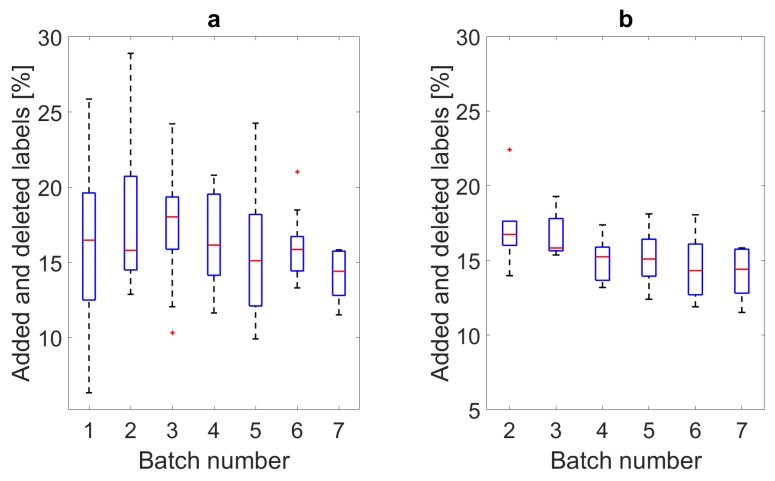
Figure 6.
Boxplots of the effort required for manual correction of each batch of subjects using the smart annotation approaches. (a) Shows the actual effort per batch where Batch 1 was using the edge-detection method and Batches 2 to 7 were using the hHMM method, where the data from the previous batches is always added to the training set of the subsequent model. (b) Shows the labeling effort for each batch’s hHMM model when predicting the subject data from Batch 7.

