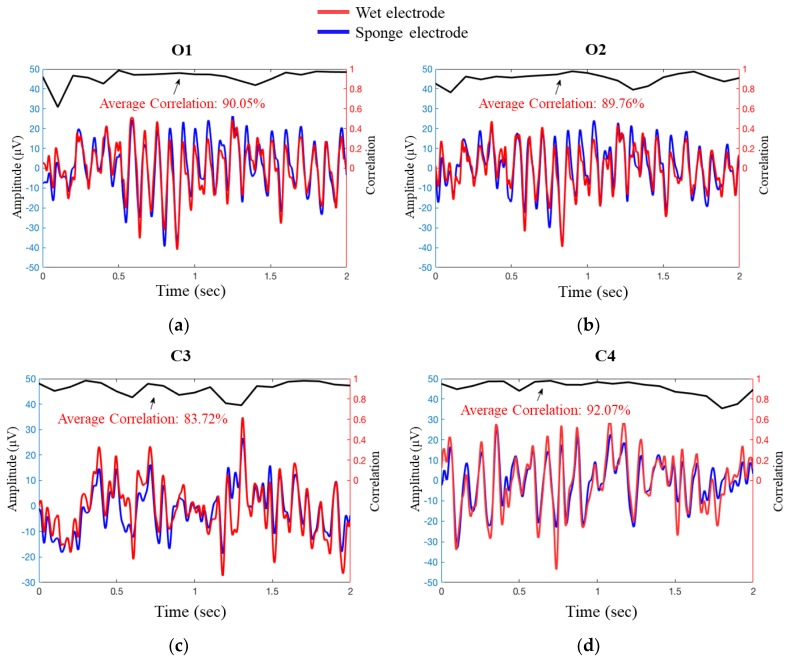
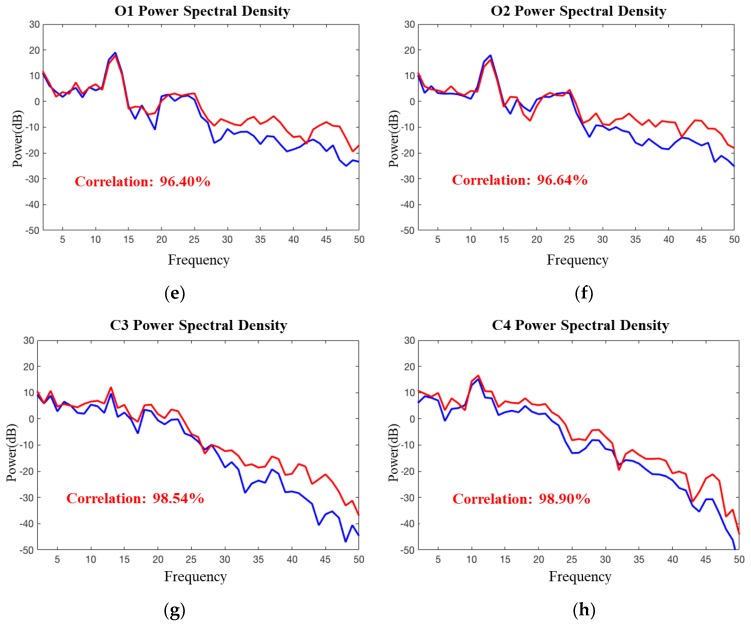
Figure 10.
Signal validation between wet and sponge electrodes. (a–d) show the signal acquired from O1, O2, C3, and C4 channels in the time domain, along with their correlation. The EEG potentials recorded through the sponge electrode are shown by the blue line, the red line indicates the signal recorded through the disk electrodes, and the black line on the top demonstrates their correlation. Averaging was performed over a 0.2-s period using a 0.1-s sliding window; (e–h) show the signal of O1, O2, C3, and C4 channels, respectively, along with fast Fourier transform (FFT) and correlation. The blue line and red line represent the signal recorded through the sponge electrode and the disk electrode, respectively.


