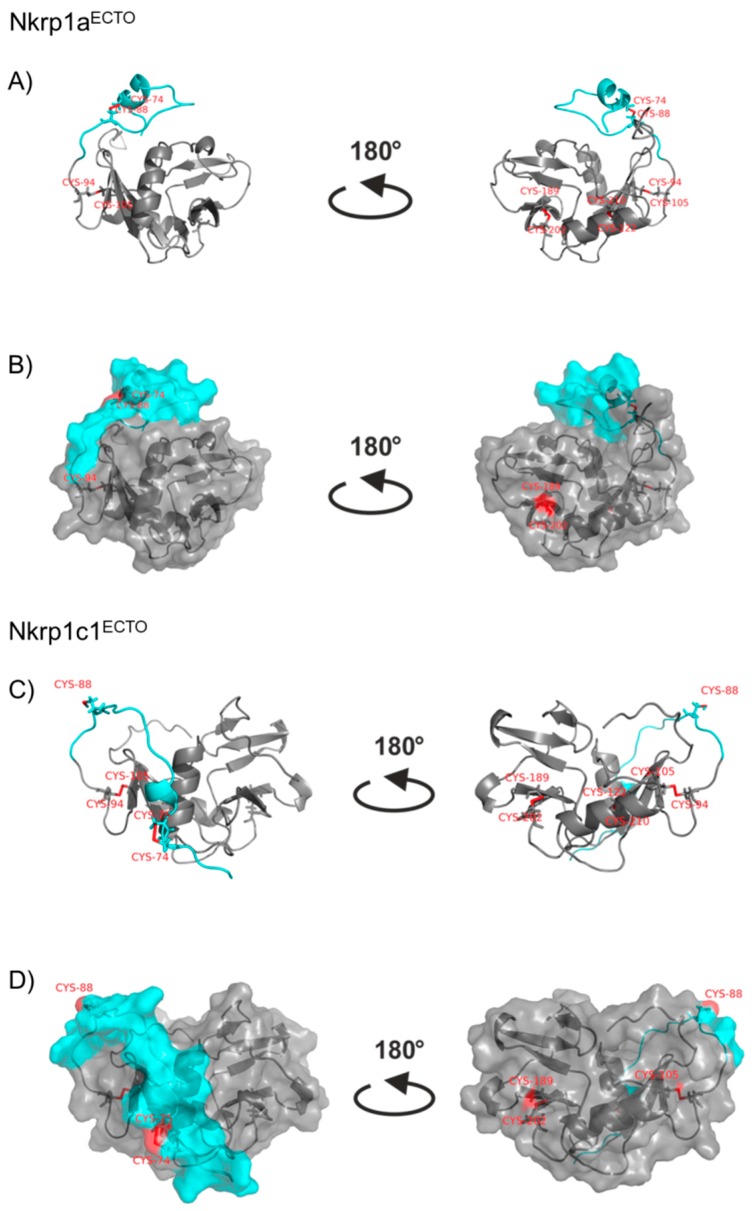
Figure A4.
Structural models of Nkrp1aECTO and Nkrp1c1ECTO proteins. Ribbon diagrams of Nkrp1aECTO (A) and Nkrp1c1ECTO (C) with the stalk regions indicated in cyan. The molecular surfaces of Nkrp1aECTO (B) and Nkrp1c1ECTO (D) are represented in faint gray, and the stalk regions in cyan. Cysteine residues are shown in red.

