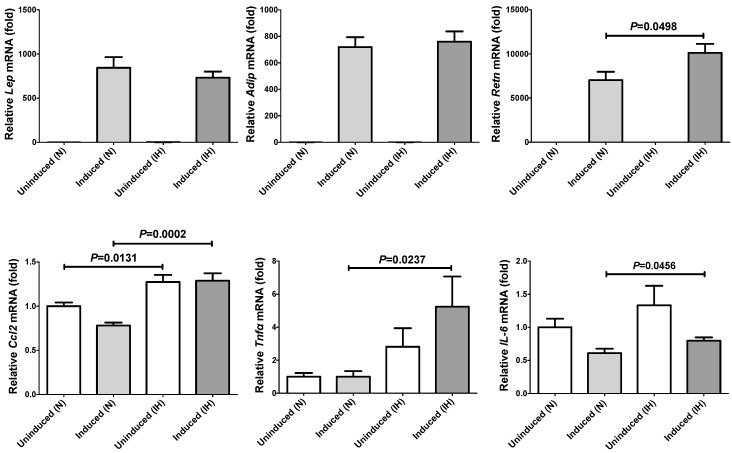
Figure 3.
The mRNA levels of Lep, Adip, Retn, Ccl2, Tnfα, and IL-6 in 3T3-L1 cells treated by normoxia or IH for 24 h. Figure shows relative comparison of mRNA expression in 3T3-L1 preadipocytes with 3T3-L1 adipocytes. The levels of the adipokine mRNAs were measured by real-time RT-PCR using Rig/RpS15 as an endogenous control. Data are expressed as mean ± SE for each group (n = 4). The statistical analyses were performed using Student’s t-test.

