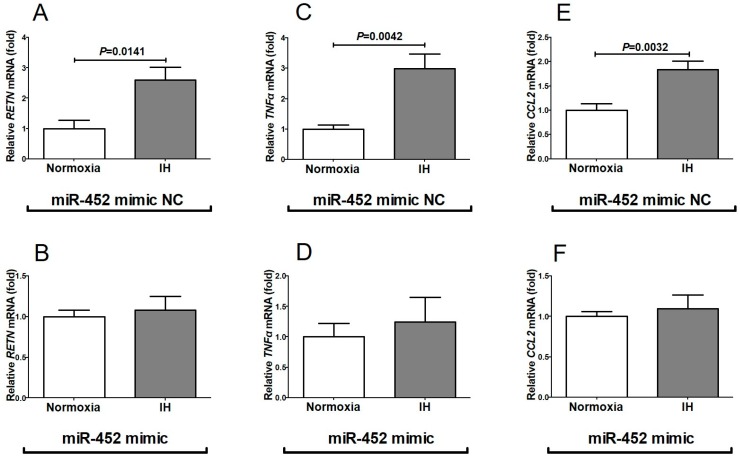
Figure 7.
Effects of miR-452 mimic transfection on RETN, TNFα, and CCL2 expression. The miR-452 mimic (5′-AACUGUUUGCAGAGGAAACUG-3′, 5′-GUUUCCUCUCUGCAAACAGUUUU-3′) and non-specific control RNA (miR-452 mimic NC) (5′-UUCUCCGAACGUGUCACGUtt-3′, 5′-ACGUGACACGUUCGGAGAAtt-3′) were synthesized by Nihon Gene Research Laboratories, Inc. (NGRL; Sendai, Japan) and introduced into SW872 cells using Lipofectamine® RNAiMAX just before IH/normoxia exposure, and the mRNA levels of RETN, TNFα, and CCL2 were measured by real-time RT-PCR, as described in Materials and Methods. The expression of RETN, TNFα, and CCL2 mRNA was measured by real-time RT-PCR using β-actin as an endogenous control. Figure represents (A) RETN mRNA expression in miR-452 mimic NC-introduced cells, (B) RETN mRNA expression in miR-452 mimic-introduced cells, (C) TNFα mRNA expression in miR-452 mimic NC-introduced cells, (D) TNFα mRNA expression in miR-452 mimic-introduced cells, (E) CCL2 mRNA expression in miR-452 mimic NC-introduced cells, and (F) CCL2 mRNA expression in miR-452 mimic-introduced cells. Data are expressed as mean ± SE for each group (n = 6). The statistical analyses were performed using Student’s t-test.

