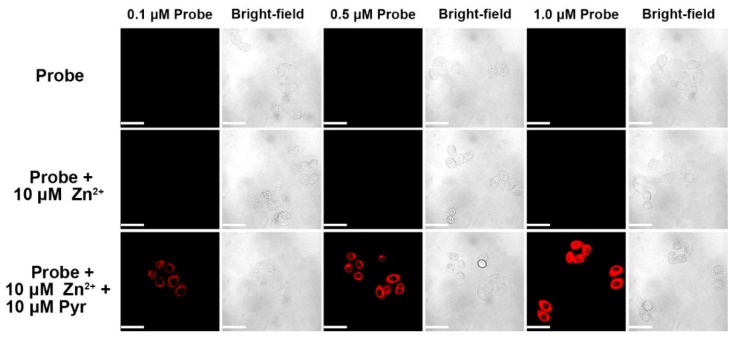
Figure 6.
Fluorescence images of fluorescent probe A with concentration at 0.1 µM, 0.5 µM, and 1.0 µM in HeLa cells. Cells were incubated with probe A with specific concentration for 30 min. Cells were then supplemented with either 10 µM of zinc(II) chloride or 10 µM each of zinc(II) chloride plus sodium pyrithione (Pyr) for 30 min before acquiring images. Scale bar: 50 µm. λex: 635 nm.

