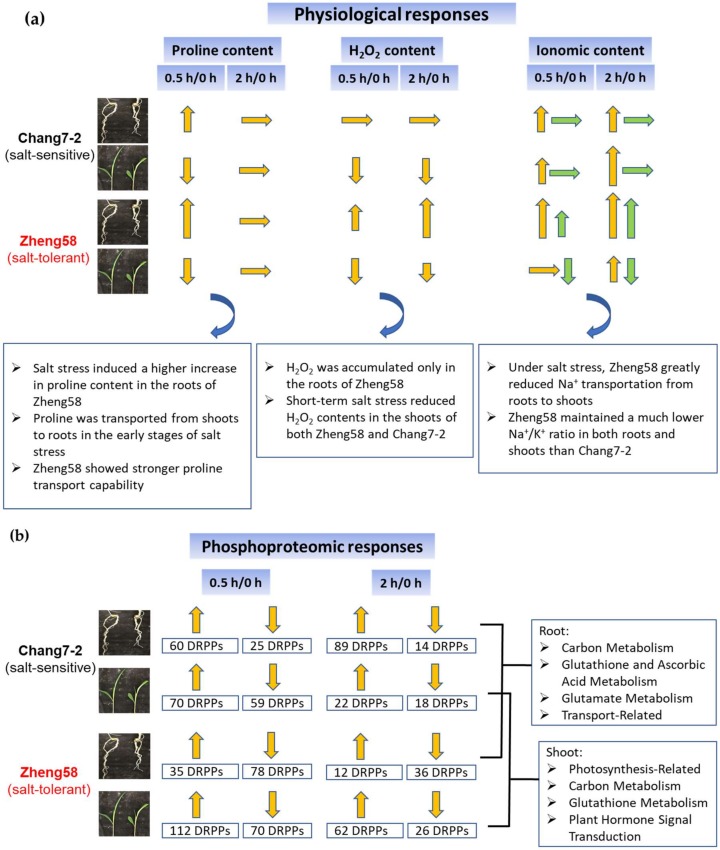
Figure 8.
A summary of differences in physiology (a) and phosphoproteomics (b) in response to salinity stress in roots and shoots of Chang7-2 and Zheng58. The up arrows indicate upregulation and the down arrows indicate downregulation; The lengths of the arrows indicate the degree of changes; In the ionomic content section, the yellow arrows represent Na+ and the green arrows indicate K+.

