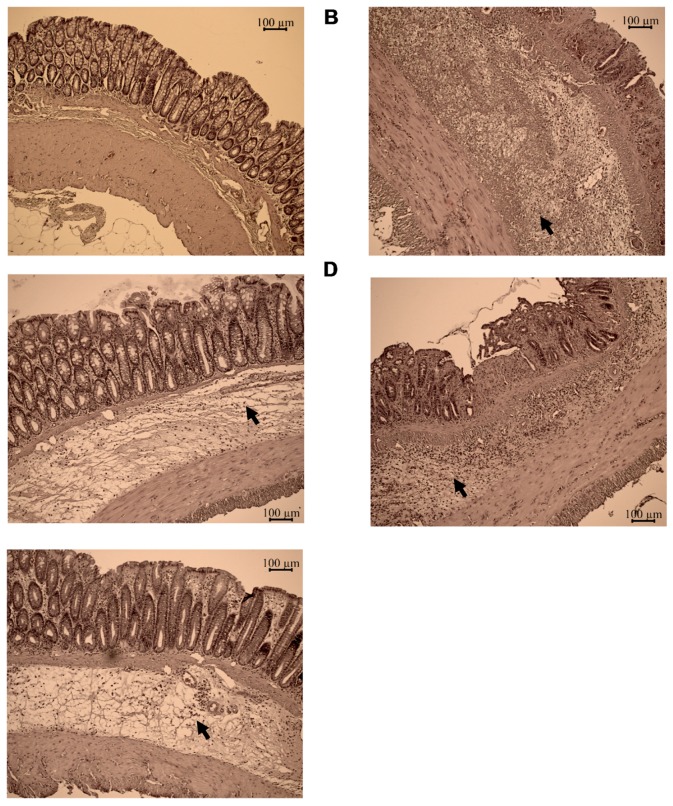
Figure 3.
The TNBS-induced colitis developed to local inflammation (tissue oedema and infiltration of inflammatoy cells, arrowheads) in the colon. Experimental groups were as follows: (A) Absolute control, (B) TNBS-induced colitis, (C) TNBS + C142, (D) TNBS + C150, and (E) TNBS + Infliximab. Representative H and E images of colon preparations after treatments as described in Section 4.4 in Materials and Methods. Scale bar = 100 μm.

