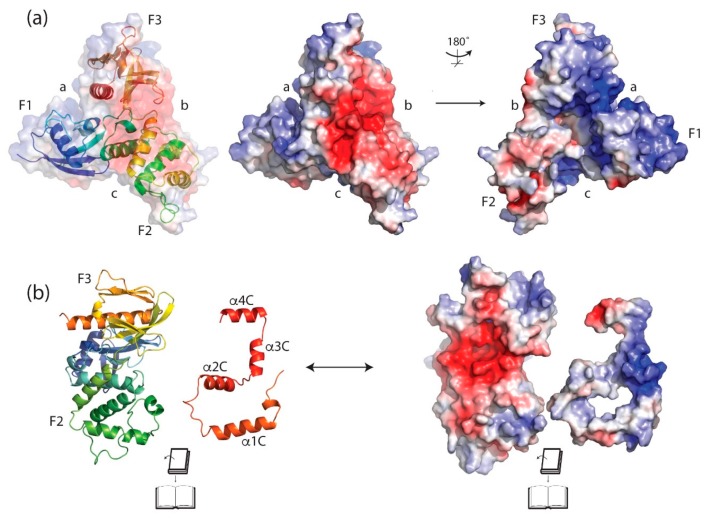
Figure 5.
Surface electrostatics of the human ezrin. (a) Surface electrostatics of the ezrin FERM domain (PDB 4RMA, [56]). Left panel shows the protein backbone (ribbon diagram) overlayed with a transparent electrostatic surface. The clefts between FERM subdomains are labeled a, b and c. Middle panel shows the electrostatic surface in the same view, while the right panel is rotated 180° about a vertical axis in the plane of the page. The cleft between FERM subdomains F2 and F3 (labeled b) shows a large area of negative charge (red, middle panel) while the cleft between subdomains F1 and F3 (labeled a) shows a large surface of positive charge (blue, right panel). (b) The interface between the FERM and CTD complex is visualized by separating these domains and rotating the CTD by 180° about a vertical axis in the plane of the page (left panel). The right panel shows the electrostatic surface potential calculated for the separated FERM and CTD domains. It is clear that charge complementarity is important in stabilizing the FERM:CTD complex. Image rendered in PyMOL [63] showing Poisson–Boltzmann electrostatic potential calculated with PDB2PQR [66].

