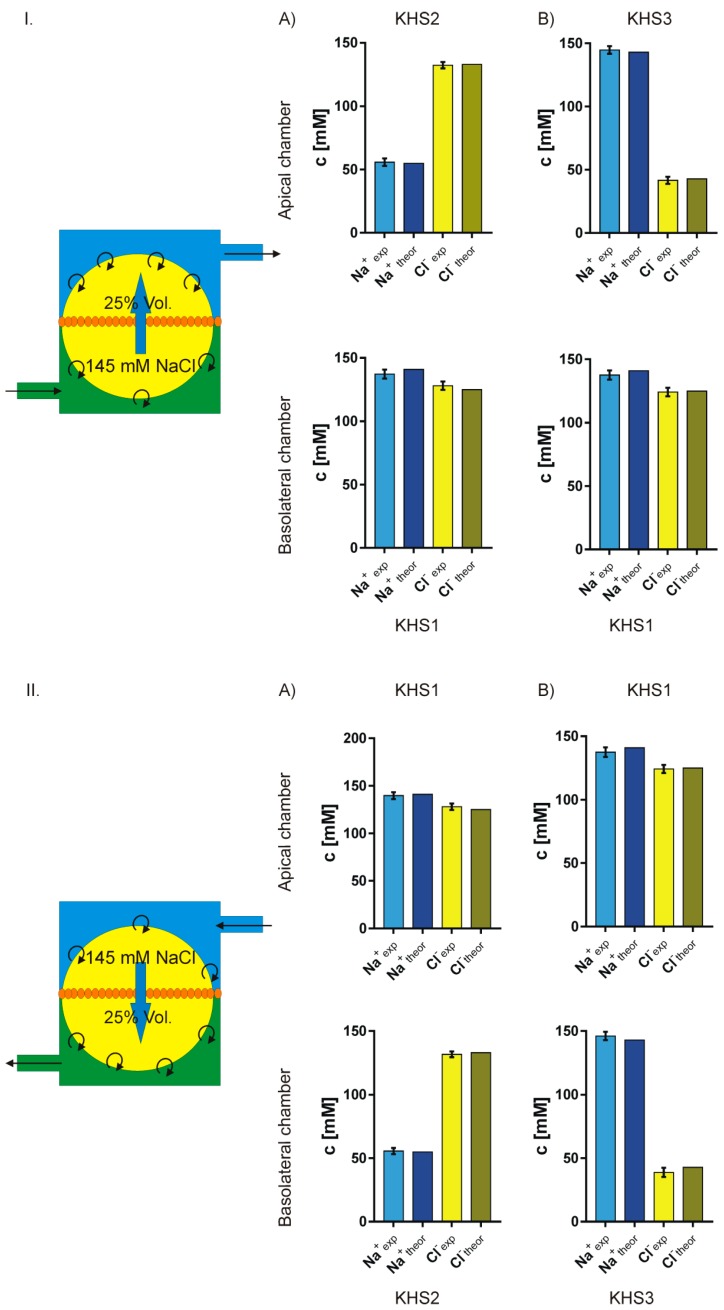
Figure 7.
Comparison of the measured and theoretically predicted concentrations of sodium and chloride on both sides of the cell layer. The theoretical model illustrated on the left of the figures assumes that there is an isosmotic transport of 25% of chamber volume of 145 mM NaCl solution from one side of the cell membrane to the other. I. (A,B) lower concentration of sodium or chloride respectively on the apical side. II. (A,B) lower concentration of sodium or chloride respectively on the basolateral side.

