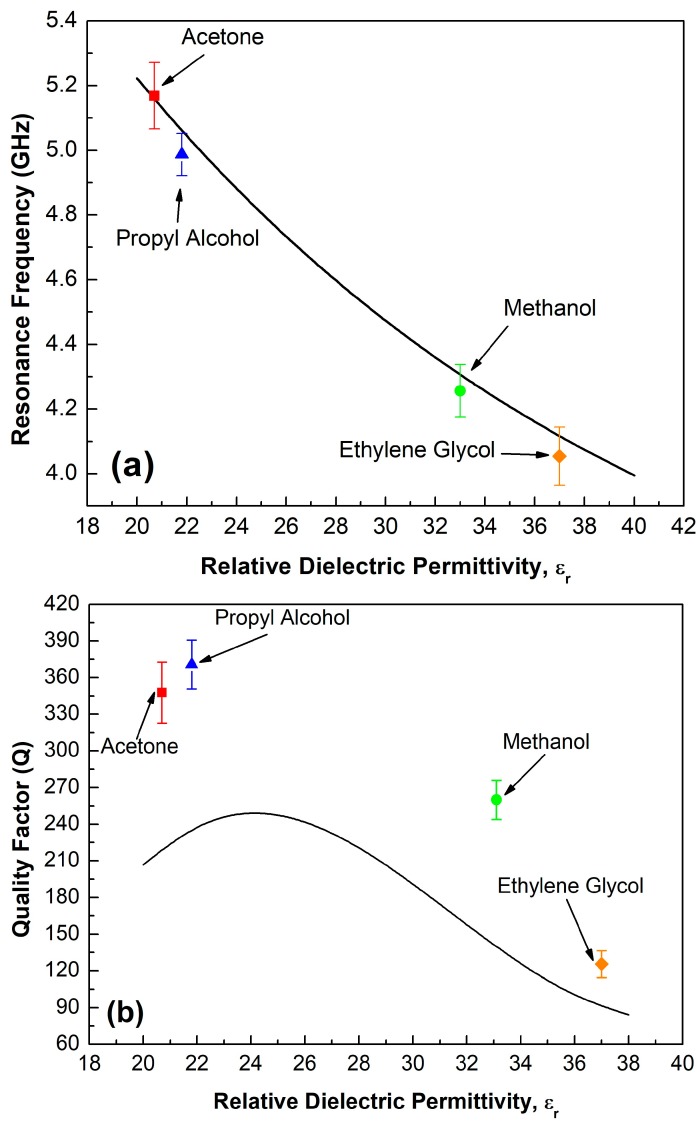
Figure 4.
(a) Resonance frequency in function of the dielectric permittivity of different liquids. (b) Quality factor analysis of the proposed sensor within the operating range. The point in the plot are the mean value of the resonance frequency and the bars are representative of the standard deviation.

