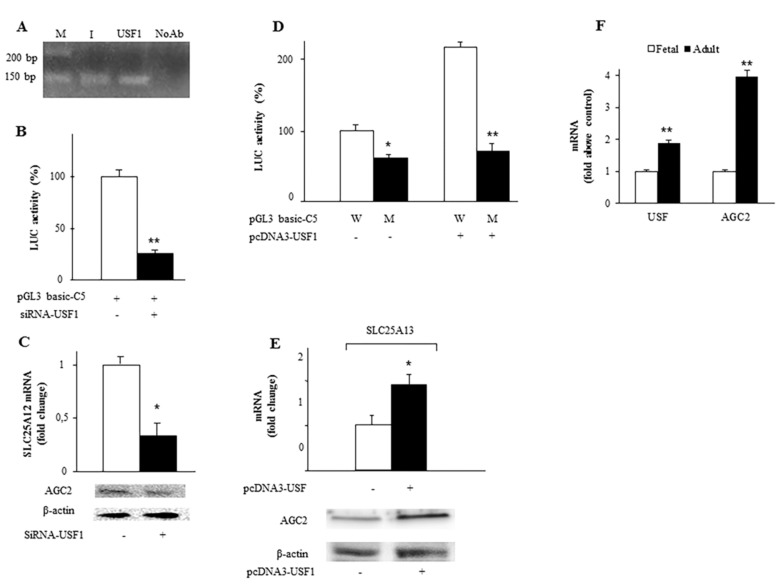
Figure 2.
Effect of USF1 on SLC25A13 gene expression. (A) ChIP-qPCR assay shows the amplification bands of PCR using the specific primers suitable to amplify the −498/−343 bp region of the SLC25A13 gene promoter. M: Marker, lane I: Input, lane USF1: amplification PCR band after ChIP with specific antibody for human USF1, lane NoAb: without the anti-USF1 antibody addition. (B) Luciferase activity was measured in HepG2 cells co-transfected with C5 construct (−442/−19 of the SLC25A13 gene promoter) and siRNA targeting human USF1 (+, black bar) or control siRNA (-, white bar). (C) Total RNA extracted from HepG2 cells treated without (white bar) or with (black bar) siRNA against human USF1 was used to quantify SLC25A13 mRNA by real-time PCR. Immunodecoration was performed with specific antibodies for AGC2 and β-actin proteins in HepG2 cells treated under the conditions described. (D) Luciferase activity of HepG2cells co-transfected with pGL3 basic-LUC vector containing the −442/−19 SLC25A13 promoter region wild-type (W) or mutated (M) in USF1 site and pcDNA3-USF1 (+: black bar) or empty pcDNA3 (-: white bar). (E) Total RNA extracted from HepG2 cells transfected with pcDNA3-USF1 (+) or empty pcDNA3 (-) was used to quantify SLC25A13 mRNA by real-time PCR. AGC2 and β-actin of HepG2 cells transfected with pc-DNA3-USF1 (+) or empty pcDNA3 (-) were immunodecorated with anti-AGC2 and anti-β-actin antibodies. (F) Total RNA from liver foetal cells (white bar) and adult (black bar) was used to quantify USF1 and SLC25A13 mRNAs by real-time PCR. For panels (B–F), means ± SD of three duplicate independent experiments are shown; all differences between samples and relative controls were significant (*p < 0.05 or **p < 0.01 one-way ANOVA followed by Student’s t-test).

