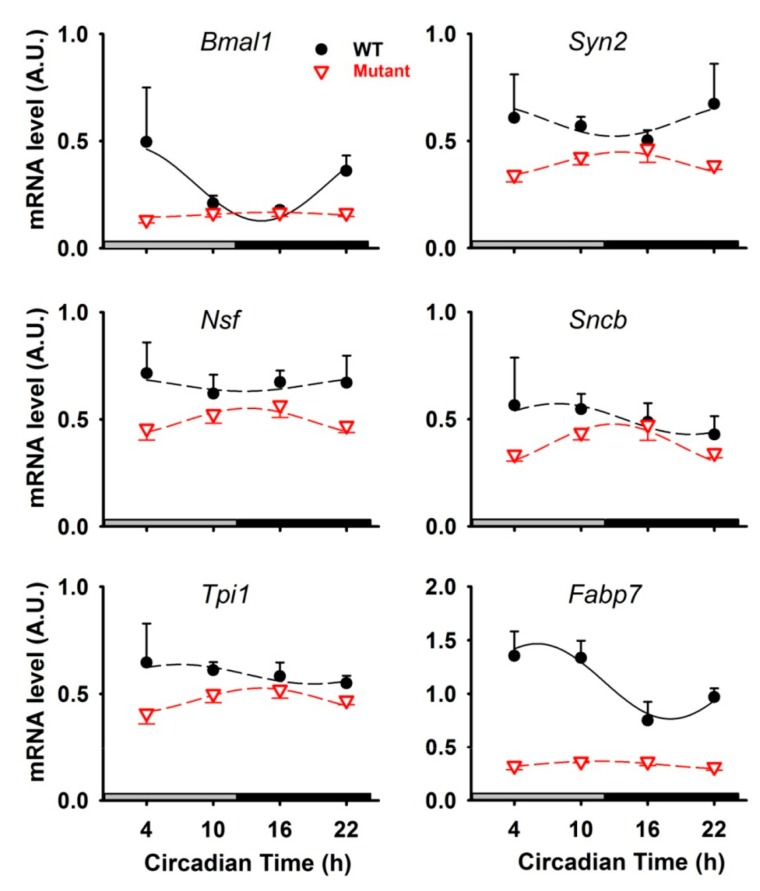
Figure 5.
Circadian expression of genes in the cerebellum of wild-type (WT, black curves) and Per1-/-/Per2Brdm1 mutant mice (Mutant, red curves). Fitted solid and dashed curves represent significant and non-significant cosinor regressions, respectively. Data are presented as means ± SEM. A.U., arbitrary unit. Bmal1, Brain and Muscle Aryl-hydrocarbon receptor nuclear translocator-like protein 1; Syn2, Synapsin 2; Nsf, Vesicle-fusing ATPase; Sncb, β-synuclein; Tpi1, Triosephosphate isomerase 1; Fabp7, Fatty acid binding protein 7.

