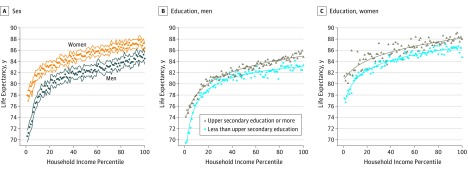
Figure 1. Life Expectancy by Income and Education Level in Norway, 2011-2015.
The solid lines represent predicted life expectancy estimated from a fractional polynomial of income. Panel A shows life expectancy by income percentile with 95% CIs and panels B and C show life expectancy by income percentiles by highest and lowest level of education. Estimated life expectancy was based on actual mortality rates and is presented as expected age at death. Estimates are based on the total Norwegian population aged at least 40 years, excluding individuals with the lowest 3% income and individuals with immigrant background.

