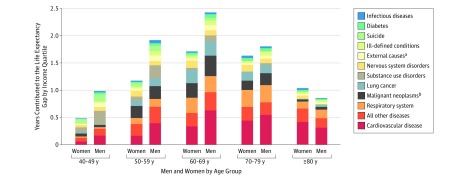
Figure 3. Gaps in Life Expectancy Between the Highest and Lowest Income Quartiles by Age and Causes of Death in Norway, 2011-2015.
The vertical length of the bars show the number of years contributed to the difference in life expectancy. Estimated life expectancy was based on actual mortality rates and presented as expected age at death. Estimates were based on the total Norwegian population aged at least 40 years, excluding individuals with the lowest 3% income and individuals with immigrant background. The decomposition was done using Arriaga’s method.22,23,24 Nervous system disorders include Alzheimer disease and dementia.
aInjuries excluding suicide and substance use.
bExcluding lung cancer.

