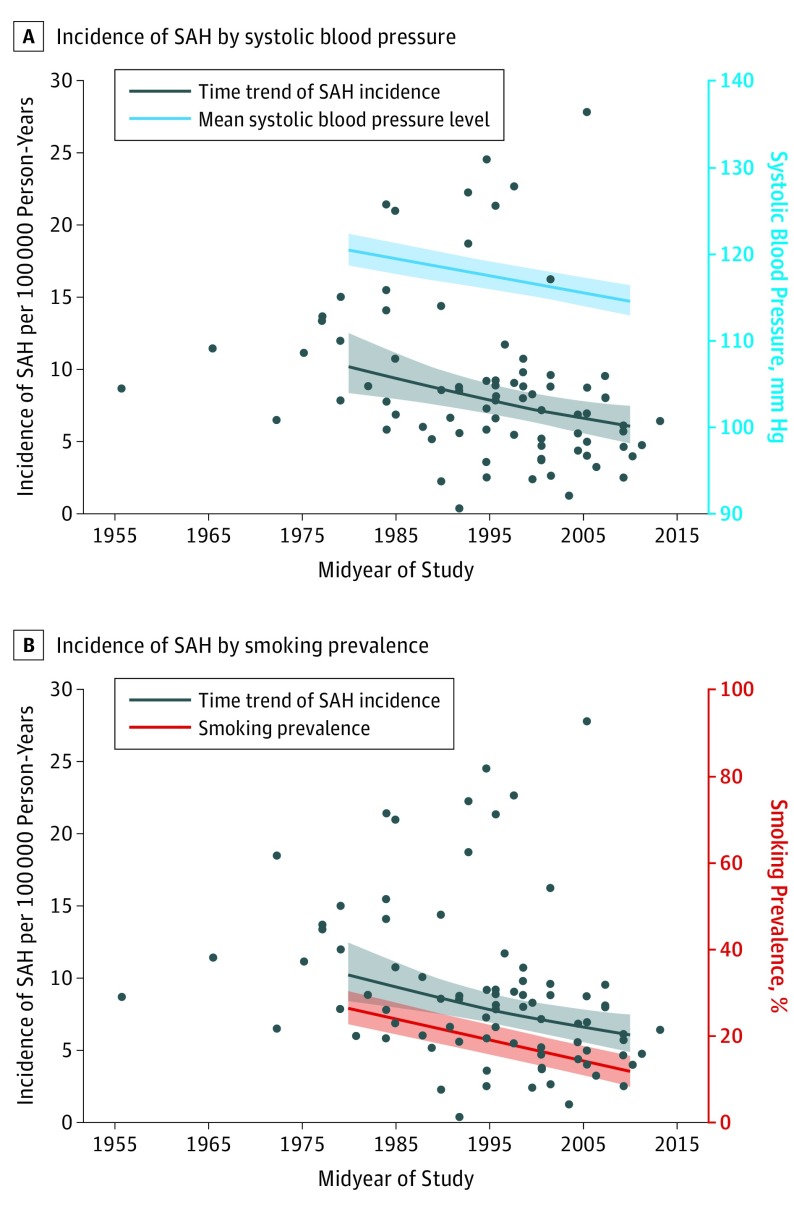
Figure 3. Association of Time Trends of Blood Pressure and Smoking Prevalence With Subarachnoid Hemorrhage (SAH) Incidence.
A, Time trends in SAH incidence in all studies by midyear are presented irrespective of age and sex (black dots). The black line indicates the regression/time trend of SAH incidence with markers for mean estimated incidence for 1980 and 2010. The blue line indicates mean systolic blood pressure levels in studies included in the age-specific and sex-specific analyses, with markers for mean estimated systolic blood pressure levels for 1980 and 2010. B, Time trends in SAH incidence in all studies by midyear are presented irrespective of age and sex (black dots). The black line indicates the regression/time trend of SAH incidence with markers for mean estimated incidence for 1980 and 2010. The red line indicates smoking prevalence in studies included in the age-specific and sex-specific analyses, with markers for smoking prevalence in 1980 and 2010.

