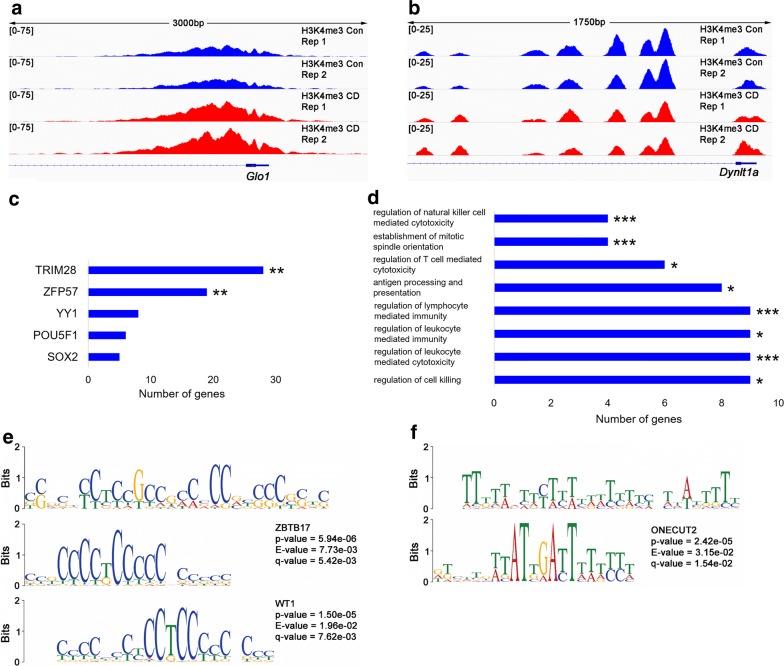
Fig. 10.
ChIP-Seq analysis of histone H3K4me3 in ovaries following CD treatment. Differential H3K4me3 peaks in the Glo1 (a) and Dynlt1a (b) genes. c Enrichment in GO terms located within the differential peaks identified by ChEA. Terms are sorted based on adjusted p values indicated at the end of each bar. d The gene ontology (GO) terms are sorted based on p value, calculated by GREAT; p values are indicated against the GO terms in the table, Fisher’s exact test. e First motif identified by MEME-CHIP. WT1 and ZBTB17 binding sites are shown below the 28-mer motif. f Second motif identified by MEME-CHIP. ONECUT2 binding site is shown below the 29-mer motif

