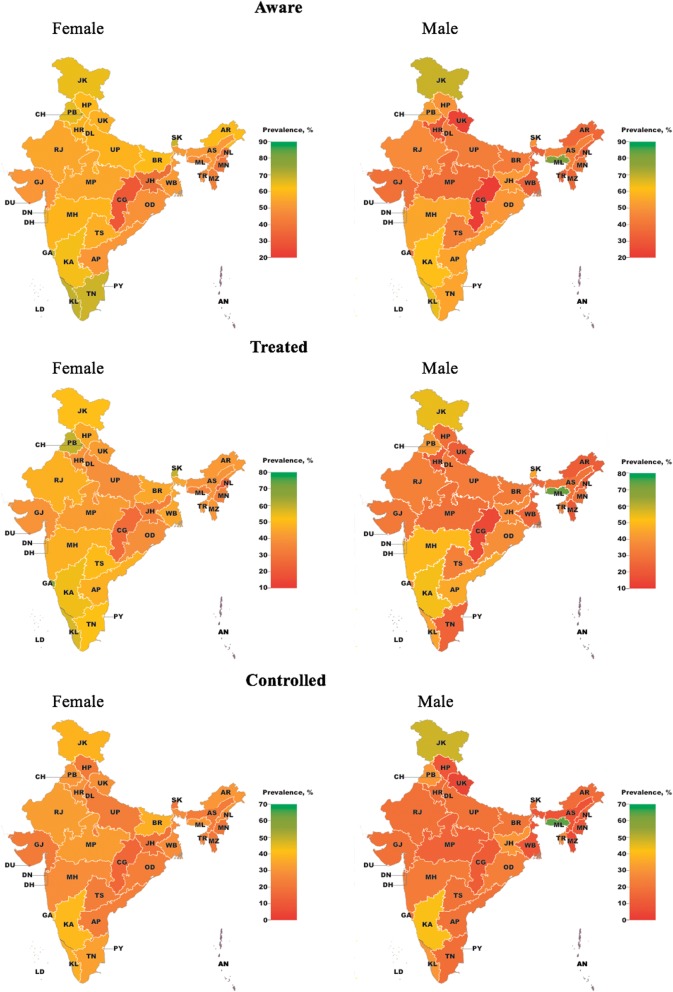
Fig. 2.
State-level variation in diabetes awareness, treatment, and control. Estimates with 95% confidence intervals are shown in Additional file 1: Table S10-S12. Diabetes prevalence estimates by sex and state are shown in Additional file 1: Table S13. Nineteen thousand four hundred fifty-three individuals with diabetes were included in this figure; 10,504 were “aware,” 8269 “treated,” and 5329 “controlled”

