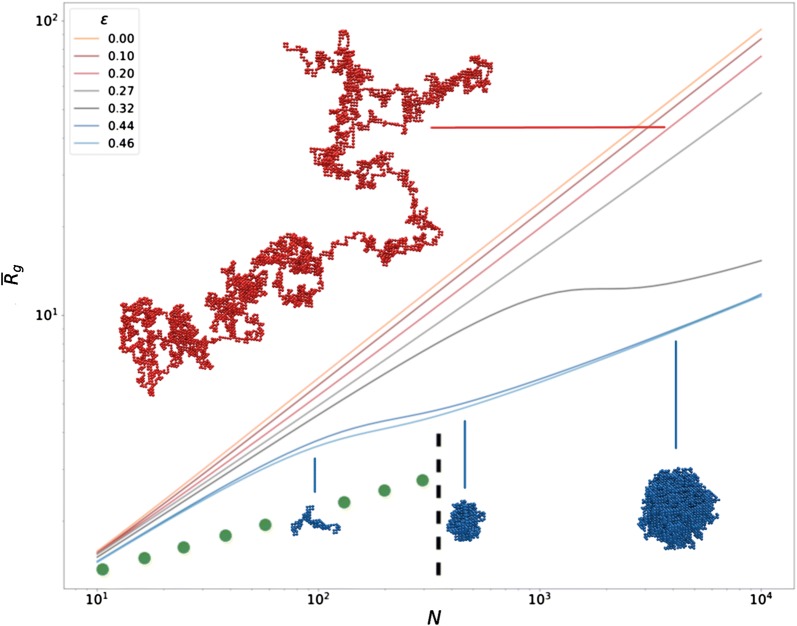
Fig. 1.
Theoretical curves for a finite-size polymer model. Log–log plot of mean radii of gyration (2) (in Kuhn length units) against the number of monomers N at different values of below and above . Typical configurations at and (red), and , 538 and 5012 (from left to right, blue) are shown. The green dots are a rough representation of the radius of gyration as a function of the domain length from the simulated sticky polymer domain of Ref. [2] (Fig. 4c), up to the close packing limit (dotted line)

