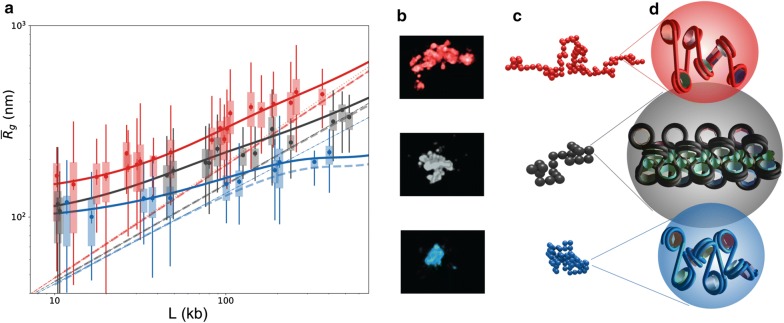
Fig. 3.
a Experimental data fit: mean gyration radii. Mean as a function of the domain length L calculated from the analytical model with the parameter sets of Table 3: active (red line), inactive (black line), repressed (blue line). Boxplots (same colors) correspond to the experimental data from Ref. [2]. Dashed lines are obtained from previous fitting curves by deconvolution, hence correspond to the behavior expected in an haploid system. The orange dotted lines represents the typical scaling law. A corresponding fit for median values is given in Additional file 1: Fig. S9; b Experimental images. 3D-STORM images adapted from Boettiger et al. [2] corresponding to an active, inactive and repressed domain (from top to bottom; 106, 79 and 119 kb, respectively). c Fitting model snapshots. Typical configurations of the domains shown in (b) obtained with the corresponding fitted parameters , and ; d Corresponding monomers at the fiber scale. Two-angle models of the nucleosome fibers corresponding to the fitted parameters of the domains shown in (b) and simulated in (c). In the case of black domains, the green spheres suggest the presence of H1 histones

