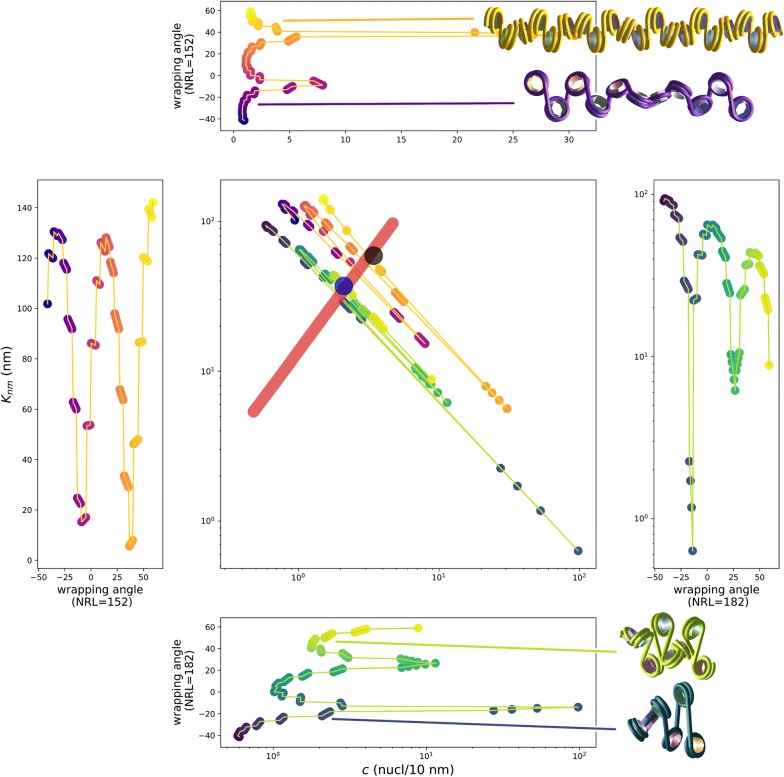
Fig. 4.
Comparison between the observed behavior and the calculations on a two-angle model of the nucleosome fiber. In the central plot, the Kuhn length is reported as a function of the compaction in nucleosomes per 10 nm. Active domains are represented by the observed power law (red thick line), while for inactive and repressed domains, we directly reported the measured values from Table 1 (black and blue dots, respectively). The colored dot-line plots correspond to the same physical quantities calculated on the basis of the two-angle model in a large range of wrapping angles, going from a completely wrapped nucleosome (angle ) to a largely open one (angle ). The angle dependence is explicitly accounted for in the four lateral plots. Two cases with NRL = 182 bp (blue-green) and NRL 152 bp (purple-orange) are reported here. The four displayed fibers are completely regular fibers obtained by using the two-angle model for the following parameter sets : , NRL 152 bp (yellow-orange fiber); , NRL 152 bp (purple fiber); , NRL = 182 bp (yellow-green fiber); , NRL 182 bp (blue-green fiber). For each fiber picture, the length corresponds precisely to one Kuhn length as calculated from the corresponding parameter set

