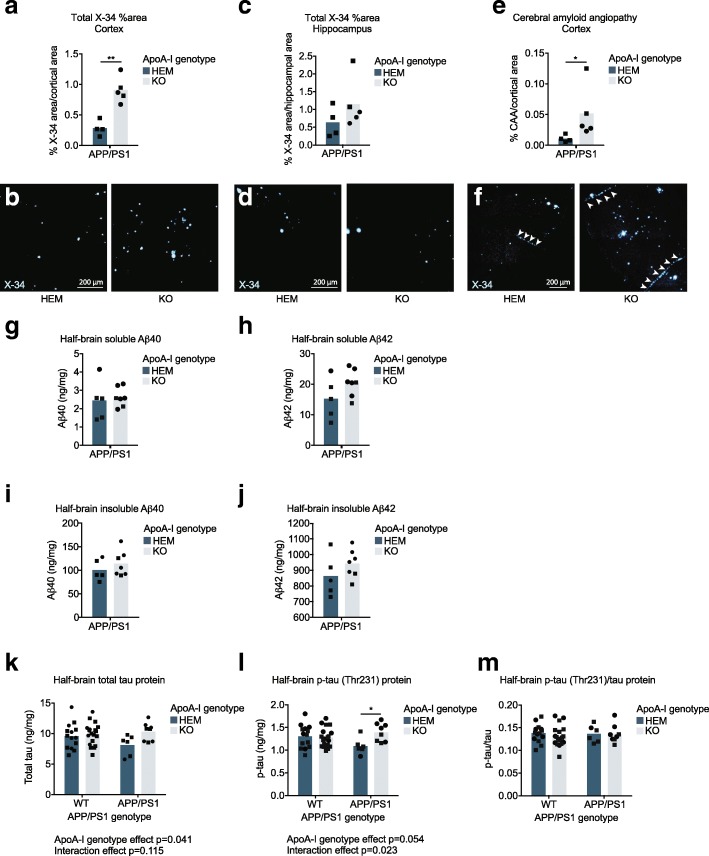
Fig. 2.
Cortical amyloid plaques and vascular Aβ deposition were increased the absence of apoA-I. Total (a, b) cortical and (c, d) hippocampal area occupied by amyloid deposits and (e, f) CAA area were evaluated by staining fixed cryosections with X-34. Representative images are below graphs. g Soluble Aβ40, h soluble Aβ42, i insoluble Aβ40, and j insoluble Aβ42 protein levels were measured in half-brain homogenates by ELISA. k Total tau and l phosphorylated tau proteins were measured by ELISA and used to calculate the (m) phosphorylated tau/total tau ratio. All analytes were normalized to homogenate total protein concentration. Points represent individual mice, and bars represent mean values. Circles represent female mice, and squares represent male mice. Arrowheads in f indicate areas of CAA. Results of unpaired t test (a) and Mann-Whitney test (e) are displayed within graphs as *p < 0.05 and **p < 0.01. Omnibus analyses of apoA-I and APP/PS1 genotype effects by two-way ANOVA are displayed as exact p values below graphs (k, l). Sidak’s multiple comparisons test results (l) are displayed within the graph as *p < 0.05. For amyloid staining, N = 4–5 mice per genotype were used; for Aβ ELISA, N = 5–7 mice per genotype were used; for tau and p-tau ELISA, N = 6–19 mice per genotype were used. apoA-I, apolipoprotein A-I; HEM, hemizygous apoA-I genotype; KO, knockout apoA-I genotype; WT, wildtype APP/PS1 genotype; APP/PS1, transgenic APP/PS1 genotype; CAA, cerebral amyloid angiopathy; Aβ, amyloid beta; p-tau, phosphorylated tau; X-34, amyloid stain

