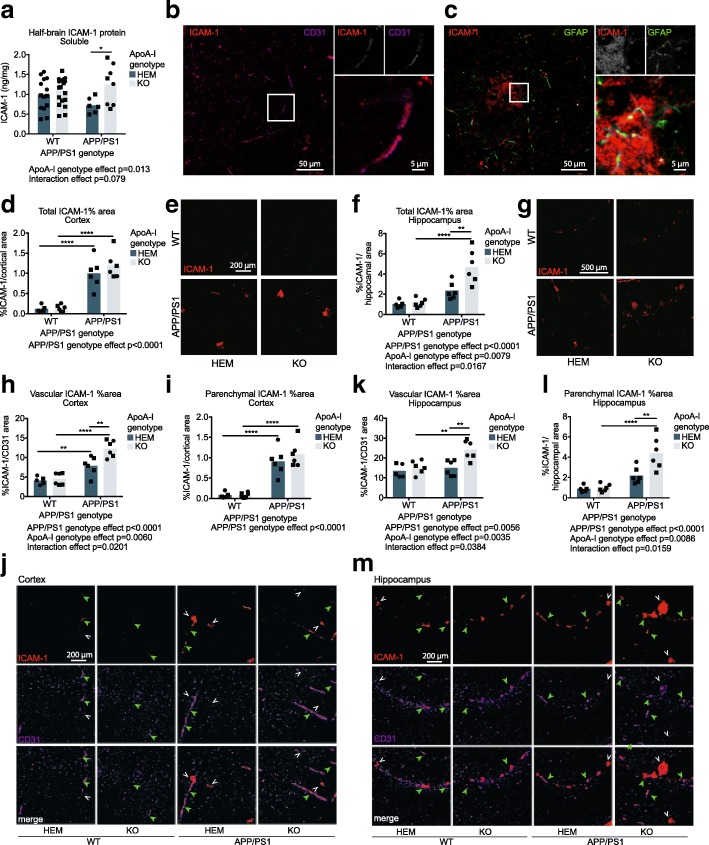
Fig. 4.
Absence of apoA-I increases ICAM-1 protein levels, hippocampal parenchymal ICAM-1 levels, and both cortical and hippocampal endothelial ICAM-1 levels. a Total ICAM-1 protein in soluble half-brain homogenates was measured by ELISA. Confocal microscopy was used to (b) identify co-localization of ICAM-1 with the endothelial cell marker CD31 and (c) evaluate the co-localization of some ICAM-1 in the brain parenchyma with GFAP-positive astrocytes. Total ICAM-1 staining area was visualized by immunofluorescence in cortical (d, e) and hippocampal (f, g) regions and positive staining area was normalized to total region area (h, j, k, m). Vascular-specific and parenchymal ICAM-1 expression was visualized using immunofluorescence and shows association of GFAP with CD31 in (h–j) cortical and (k–m) hippocampal regions, where positive co-stained area was normalized to total CD31-positive area. Representative images for immunofluorescent data are below the graphs. Points represent individual mice, and bars represent mean values. Circles represent female mice, and squares represent male mice. Omnibus analyses of apoA-I and APP/PS1 genotype effects by two-way ANOVA are displayed as exact p values below graphs. Sidak’s multiple comparisons test results are displayed within graphs as *p < 0.05, **p < 0.01, ***p < 0.001, and ****p < 0.0001. For ELISA, N = 6–19 mice per genotype were used. apoA-I, apolipoprotein A-I; HEM, hemizygous apoA-I genotype; KO, knockout apoA-I genotype; WT, wildtype APP/PS1 genotype; APP/PS1, transgenic APP/PS1 genotype; ICAM-1, intercellular adhesion molecule 1; GFAP, glial fibrillary acidic protein; CD31, cluster of differentiation 31. Green closed arrowheads indicate examples of vascular ICAM-1, and white open arrowheads indicate examples of parenchymal ICAM-1

