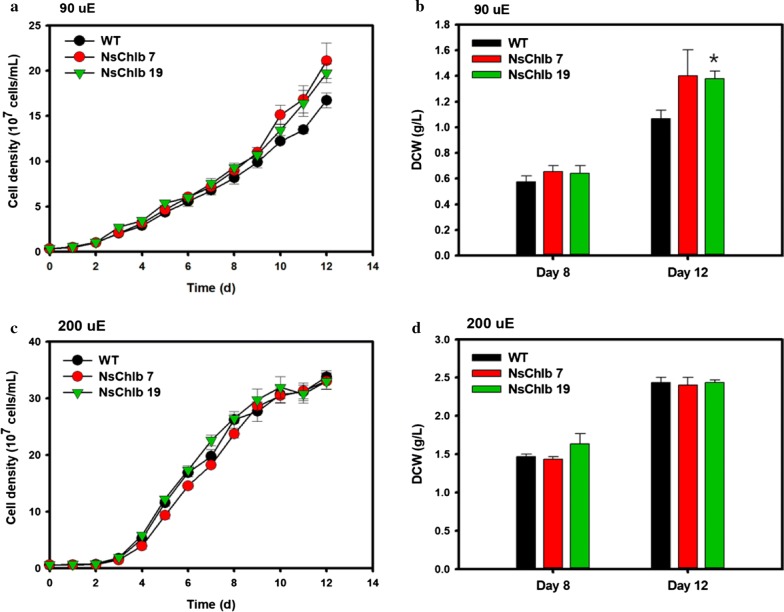
Fig. 3.
Growth analyses of Chlb synthesizing transformants under different light intensities of medium light (ML: 90 μmol photons/m2/s) and high light (HL: 200 μmol photons/m2/s). The cell density (a, c) and dry cell weight (DCW: b, d) were analyzed under ML (a, b) and HL (c, d). Data points represent means and standard errors (n = 3). Asterisks indicate the significant differences between WT and each transformants (WT vs. NsChlb7, WT vs. NsChlb19) determined by Student’s t test (*P < 0.05, **P < 0.01, ***P < 0.001)

