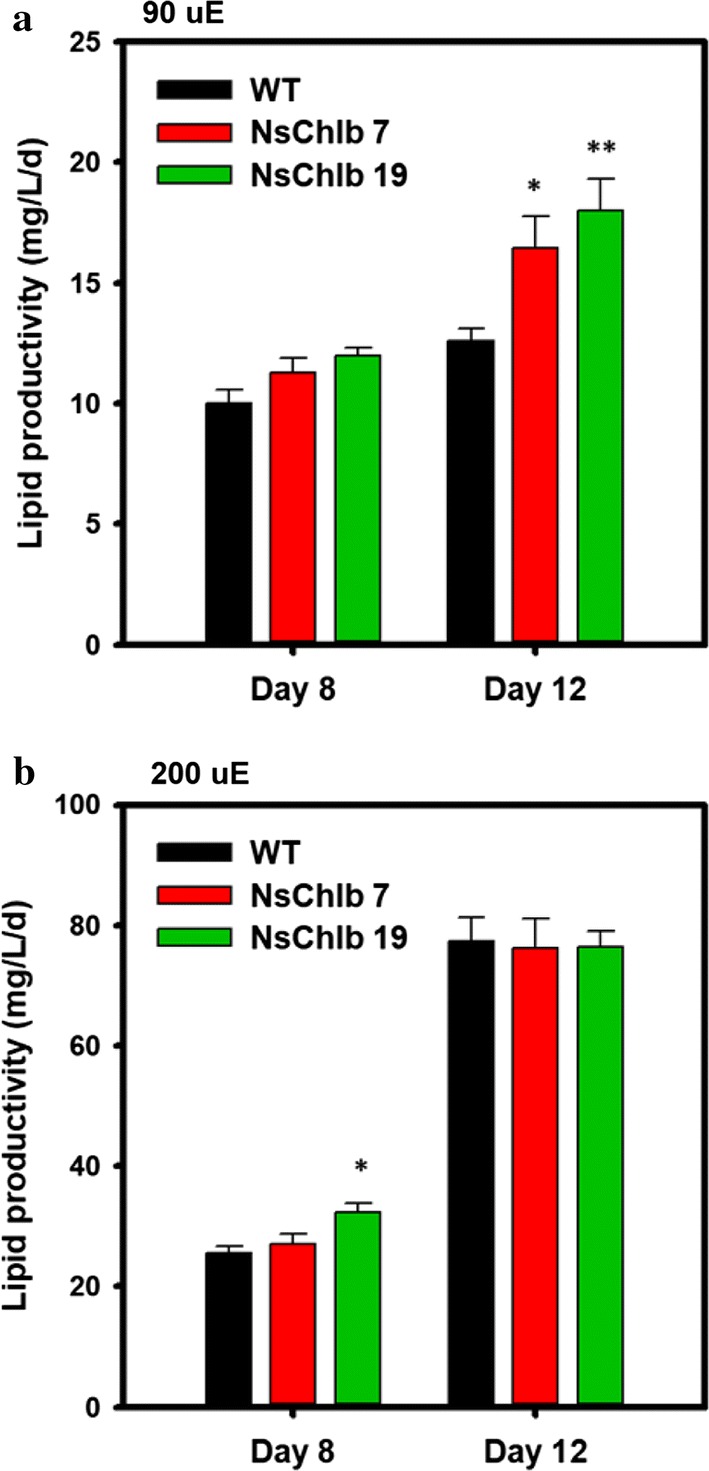
Fig. 6.

Total lipid productivities of WT and NsChlb transformants. The total lipid productivity was calculated from the biomass productivity and lipid contents divided by the cultivation period in days. Cells were cultivated under ML (90 μmol photons/m2/s) (a) and HL (200 μmol photons/m2/s) (b) at 25 °C, 120 rpm and supplying 0.5 vvm of 2% CO2. Asterisks indicate the significant differences between WT and each transformants (WT vs. NsChlb7, WT vs. NsChlb19) determined by Student’s t test (*P < 0.05, **P < 0.01, ***P < 0.001, n = 3)
