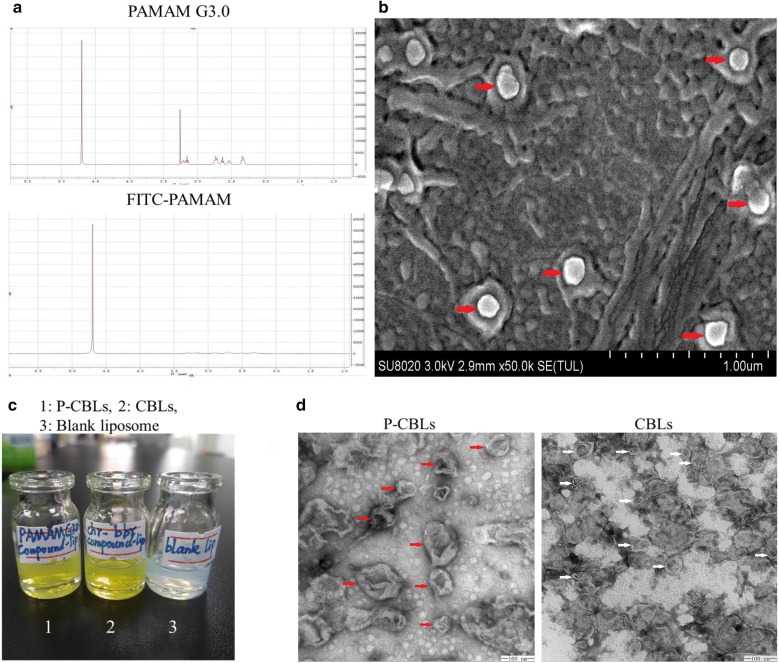
Fig. 2.
Characterization of FITC-PAMAM coated liposomes. a Verification of FITC onto PAMAM G3.0 via 1H-NMR. b SEM image of FITC-PAMAM coated liposomes (scale bar = 1 μm). c The appearance of CBLs and P-CBLs taken with camera. d TEM images of CBLs and P-CBLs, the red arrow indicates the P-CBLs and white indicates CBLs (scale bar = 100 nm)

