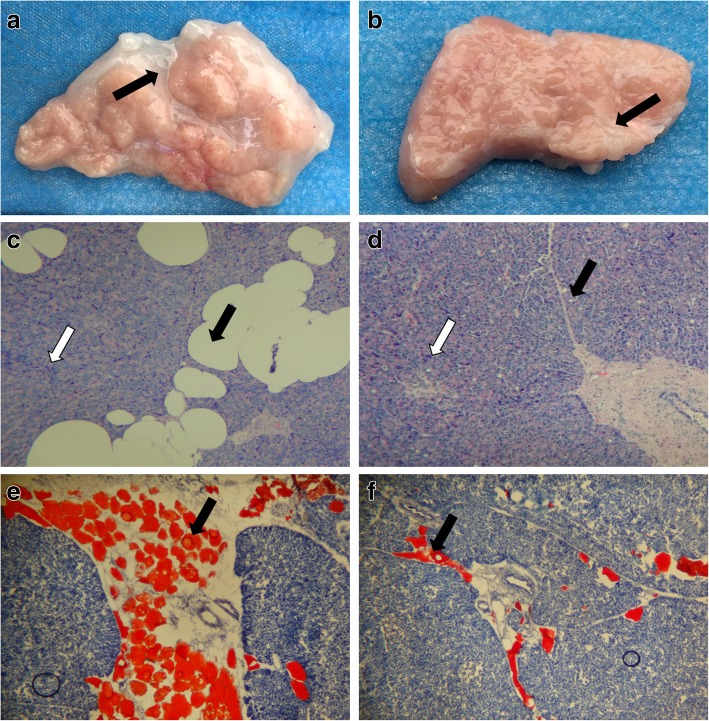
Fig. 1.
Histopathological features of the pancreas. (a, b) Transverse histologic sections of the pancreas, the adipose tissue (black arrow) in the diabetic group (a) was increased, compared with the control group (b). (c, d) Hematoxylin-eosin stain (original magnification × 100), the number of fat cells (black arrow) in the diabetic group (c) was increased, while the number of pancreatic islet cells (white arrow) was reduced, compared with the control group (d). (e, f) Oil Red O stain (original magnification × 100), adipose tissue appears orange, the degree of fat infiltration. (black arrow) in the diabetic group (e) was increased, compared with the control group (f)

