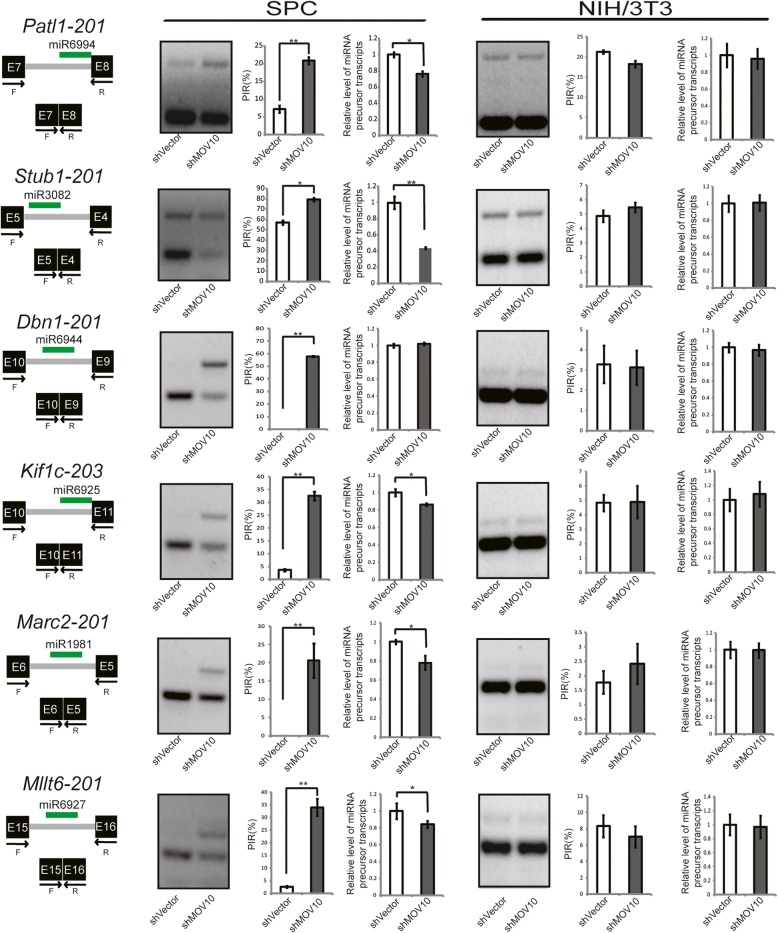
Fig. 4.
MOV10 regulates mirtron splicing in SPCs. PCR test of mirtron splicing events in SPCs and NIH/3 T3 cells. Total RNA samples from Mov10 knockdown versus control SPCs were examined by semi-quantitative RT-PCR analyses. The diagrams depict two splicing isoforms, black boxes represent exons, gray lines represent introns, green lines represent miRNAs, and arrows mark the positions of forward (F) and reverse (R) primers. E, exon number. The percent of intron retention (PIR) value, used as an indication for the extent of alteration of a splicing event, was determined as the proportion of the intron retention isoform versus the total level of intron retention and intron exclusion isoforms. The change of miRNA transcripts was calculated as the relative whole level of intron retention and intron exclusion isoforms in Mov10 knockdown over control. PCR products were quantified by Image J software. Results represent data from biological triplicates

