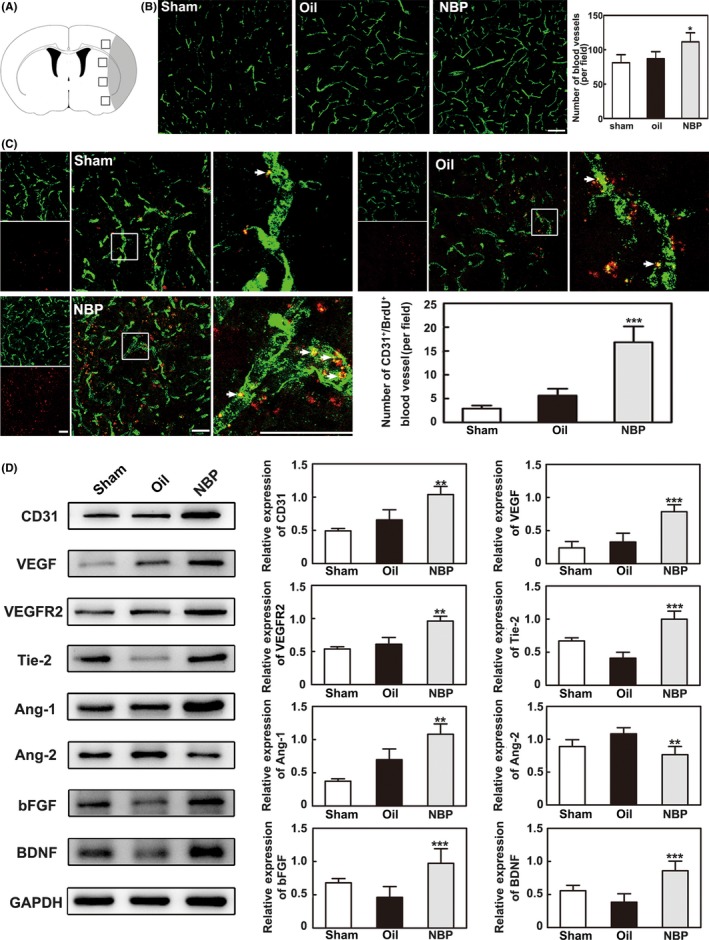
Figure 2.

NBP promoted angiogenesis 14 d after MCAO. A, A schematic diagram of the immunostained images. The black boxes represent the areas of each section selected for imaging, and the gray area represents the infarcted brain regions. B, Representative images showing the immunostaining of CD31+ microvessels in the ipsilateral hemisphere after MCAO in the sham, oil, and NBP treatment groups. Bar = 100 μm, n = 6 per group. C, Representative images showing the immunostaining of CD31 (green) and BrdU (red) double‐stained cells in ischemic rats. Bar graphs show the quantification of the CD31+/BrdU+ cells in the NBP‐treated, oil‐treated, and sham groups. Bar = 50 μm, n = 6 per group. D, Western blot showing angiogenic growth factor expression in the ischemic rat brain 14 d after MCAO. Bar graphs show the data quantification. n = 8 per group. Data are presented as the mean ± SD, * P < 0.05; ** P < 0.01; *** P < 0.001, NBP‐treated vs oil‐treated rats
