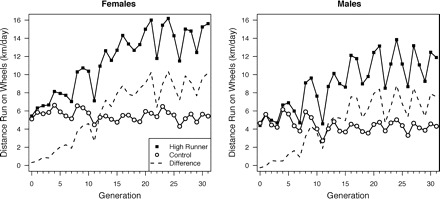
Fig. 1.

Voluntary wheel running (mean revolutions per day) on days 5 and 6 of a 6-day exposure to wheels (1.12 m circumference). Solid line with black squares is average value of the four replicate HR lines, solid line with open circles is average of four nonselected C lines, and dashed line is the differences between those averages. For both the HR and C lines, about one-third of the total revolutions (and hence distance) per day are attributable to “coasting” (Koteja et al. 1999). After generation 31, mice were moved from Wisconsin to California, and wheel running was not recorded for four generations. Data for subsequent generations are not shown.
