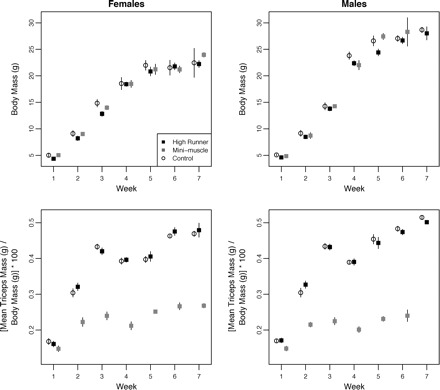
Fig. 5.

Ontogenetic change in body mass (top row) and in mass of the triceps surae muscle normalized to body mass (bottom row) during postnatal weeks 1–7 in C, normal HR, and MM-phenotype mice for females (left) and males (right). Values are simple means ± 1 SD (some of which are so small as to be obscured by the mean point). Points are slightly offset in age (weeks) for clarity.
