
. 2019 Apr-Jun;65(2):74–80. doi: 10.4103/jpgm.JPGM_571_17
Copyright: © 2018 Journal of Postgraduate Medicine
This is an open access journal, and articles are distributed under the terms of the Creative Commons Attribution-NonCommercial-ShareAlike 4.0 License, which allows others to remix, tweak, and build upon the work non-commercially, as long as appropriate credit is given and the new creations are licensed under the identical terms.
Figure 2.
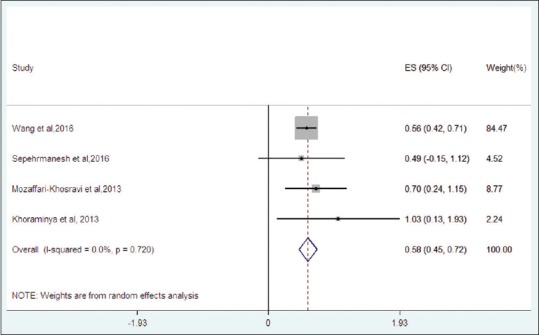
Forest plot for included trials