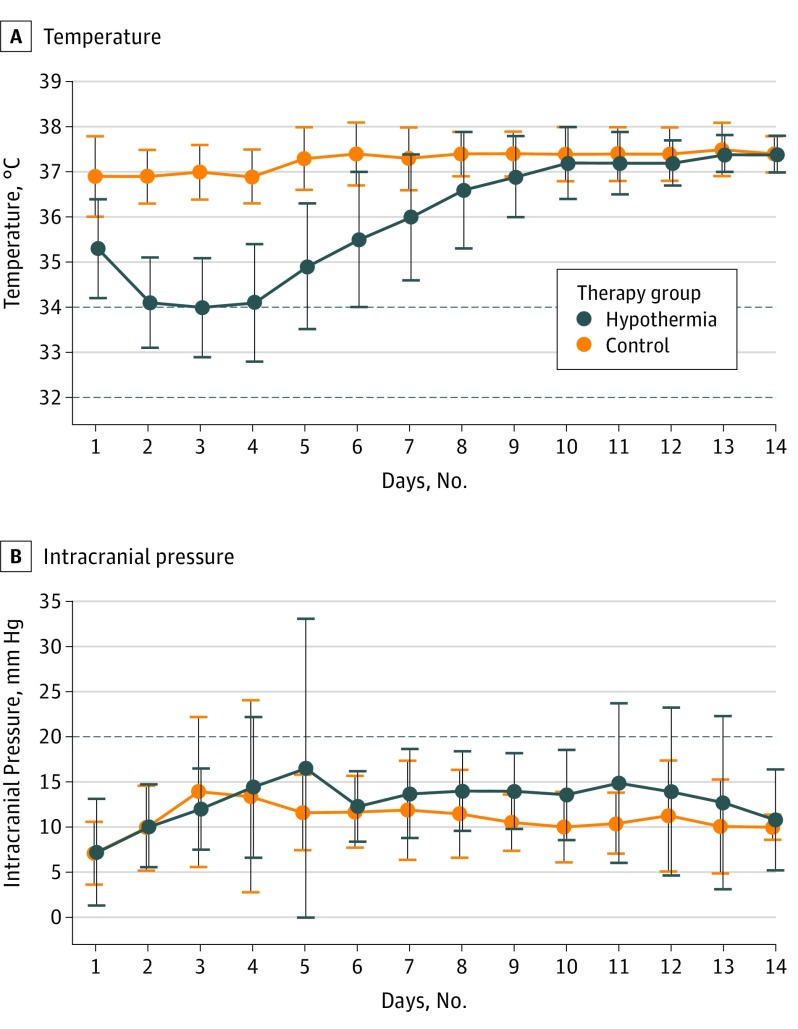
Figure 2. Temperature and Intracranial Pressure Curves.
Body temperatures (A) and intracranial pressure (B) course throughout the first 14 days after randomization. Curves are based on the mean temperature per day in each group; vertical bars indicate SDs. Baseline temperature was normal in both groups at day 1. Hypothermia was induced at day 1. Target temperature was reached in 89% of patients and maintained for a minimum of 72 hours in every patient receiving the assigned treatment. Intracranial pressure curves are based on the mean intracranial measurement per day in each group. Increased intracranial pressure was defined as increase over 20 mm Hg (horizontal line) for a period longer than 10 minutes.

