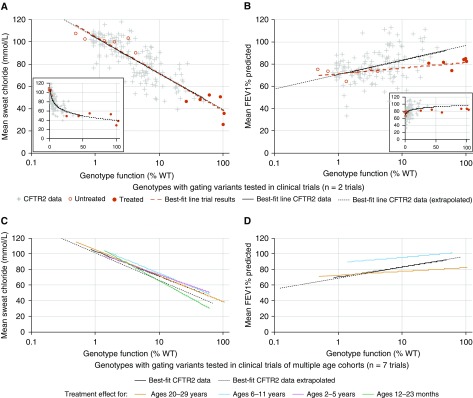
Figure 4.
Treatment effect on gating variants mirrors the relationship between genotype function and phenotype determined using Clinical and Functional Translation of CFTR (CFTR2) project data. (A and B) Genotype function versus sweat chloride ([Cl−]) (A) or FEV1% predicted (B) on a semilogarithmic plot indicates that the effect of ivacaftor treatment on individuals with gating variants does not differ from the relationship shown between these variables using CFTR2 data (solid line determined from genotypes with 0.85–50% function; dotted line extrapolates this relationship <0.85% or >50% function). Genotype function and baseline sweat [Cl−] or FEV1% predicted of individuals tested in clinical trials with duration of either 24 or 48 weeks are represented by open red circles; after treatment, genotype function (determined by in vitro Fischer rat thyroid cell testing) and resulting sweat [Cl−] or FEV1% predicted are represented by filled red circles. (A and B, insets) Genotype function versus sweat [Cl−] (A, inset) or FEV1% predicted (B, inset) illustrates the nonlinear relationship between these variables. (C and D) Treatment effect from ivacaftor on sweat [Cl−] (C) or FEV1% predicted (D) stratified by age cohort (colored lines) does not differ from the relationship between these variables using CFTR2 data (all ages included [mean age, 22 yr at time of FEV1% predicted measures]). Trials included in C and D ranged in duration from 24 to 144 weeks of treatment. All comparisons were performed using an interaction term between CFTR2 data and data from clinical trials and indicated no significant difference between the regressions for each dataset. Clinical trial data plotted are detailed in Table E4 and Methods. %WT = percentage of wild type.

