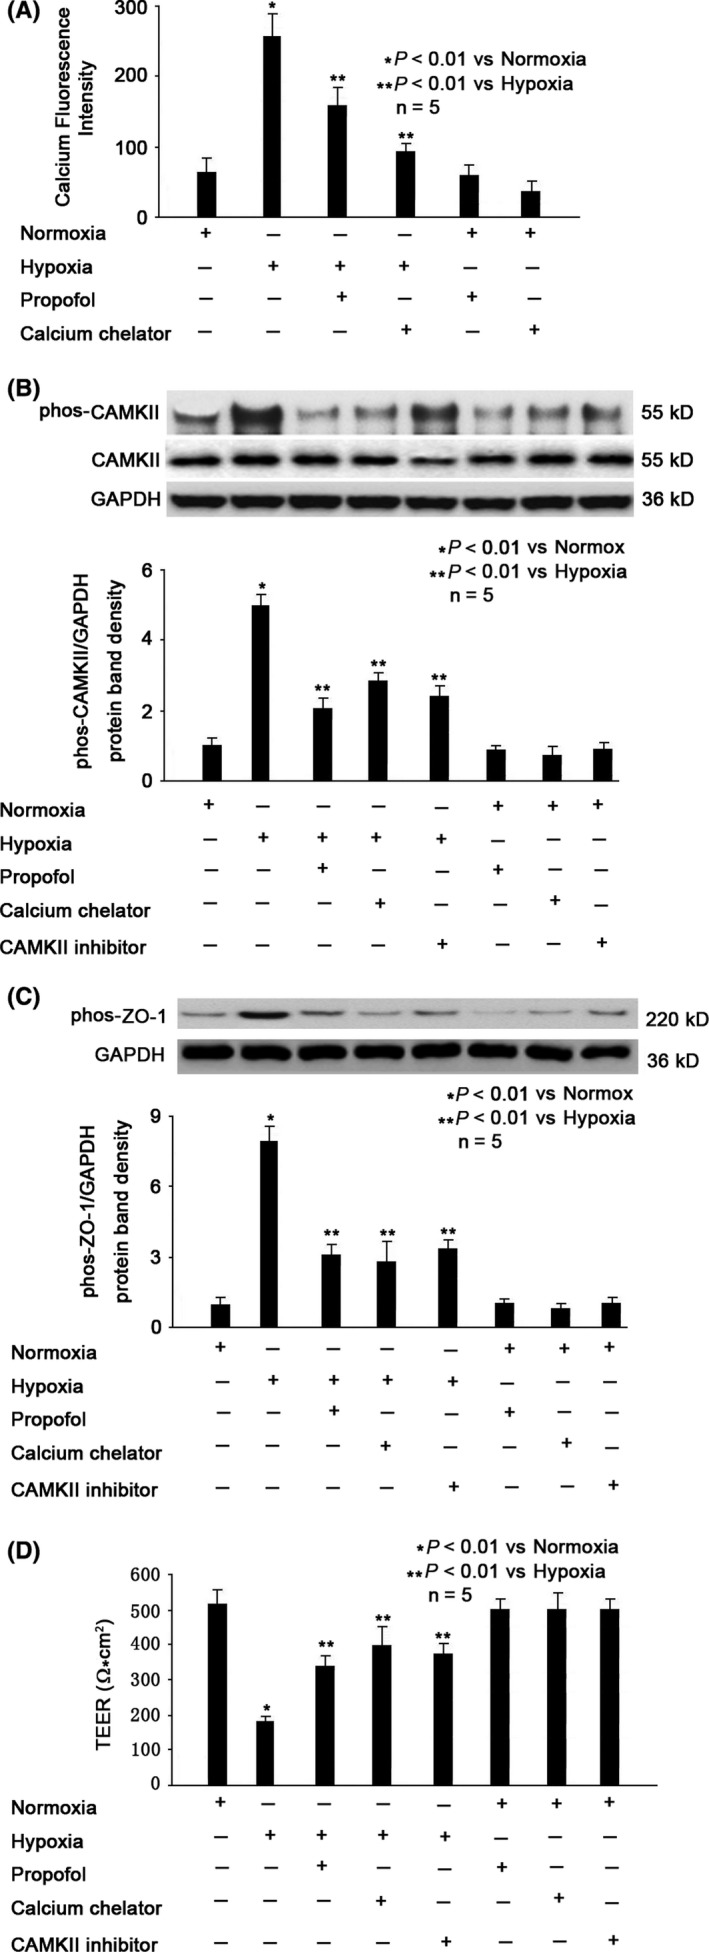
Figure 4.

Role of calcium/CAMKII in propofol‐ and hypoxia‐modulated ZO‐1 phosphorylation. A, Hypoxia‐induced intracellular calcium concentration, which was attenuated by propofol and calcium chelator. Data were expressed as fluorescence intensity, presented as mean ±standard deviation, and summarized from five separate experiments. B, Hypoxia‐induced CAMKII phosphorylation, which was attenuated by propofol, calcium chelator and CAMKII inhibitor. The upper panel was a representative experiment, and the lower panel was the summary of densitometric data from five separate experiments. GAPDH served as loading control. Data were expressed as normalized ratio of protein band density of phosphorylated CAMKII against CAMKII, which was normalized with GAPDH, and were presented as mean ±standard deviation. C, Hypoxia‐induced phosphorylation of ZO‐1, which was inhibited by propofol, calcium chelator and CAMKII inhibitor. The upper panel was a representative experiment, and the lower panel was the summary of densitometric data from five separate experiments. GAPDH served as loading control. Data were expressed as normalized ratio of protein band density of phosphorylated ZO‐1 against GAPDH and were presented as mean ±standard deviation. D, Hypoxia‐reduced BBB integrity was reversed by propofol, calcium chelator, and CAMKII inhibitor. TEER values were expressed as Ω*cm2, presented as mean ±standard deviation, and summarized from five separate experiments. Statistical comparisons were made by paired Student's t test, one‐way ANOVA followed by Tukey's post hoc test (Student's Newman‐Keuls test)
