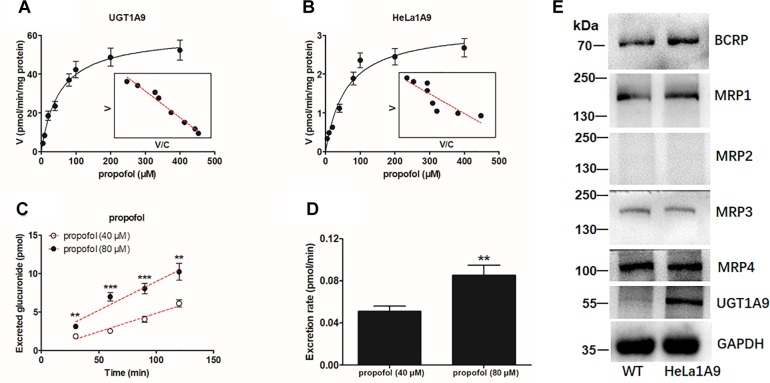
FIGURE 1.
UGT1A9-mediated propofol-O-glucuronidation, excretion of propofol-O-glucuronide in HeLa1A9 cells, and expression of UGT1A9 and efflux transporters in HeLa1A9 cells. (A) Kinetic profiles for the glucuronidation of propofol (5–400 μM) by UGT1A9. (B) kinetic profiles for the glucuronidation of propofol (5–400 μM) by the HeLa1A9 cell lysate. In each panel, the inset shows the corresponding Eadie–Hofstee plot. (C) Excreted propofol-O-glucuronide in the extracellular solution at two concentrations of propofol (40 and 80 μM). (D) excretion rates of propofol-O-glucuronide at different concentrations (40 and 80 μM). (E) protein expression of transporters UGT1A9, BCRP, and four transporters of the MRP family in HeLa and HeLa1A9 cells. Data are presented as mean ± SD. ∗p < 0.05, ∗∗p < 0.01, or ∗∗∗p < 0.001 as compared with propofol (40 μM).

