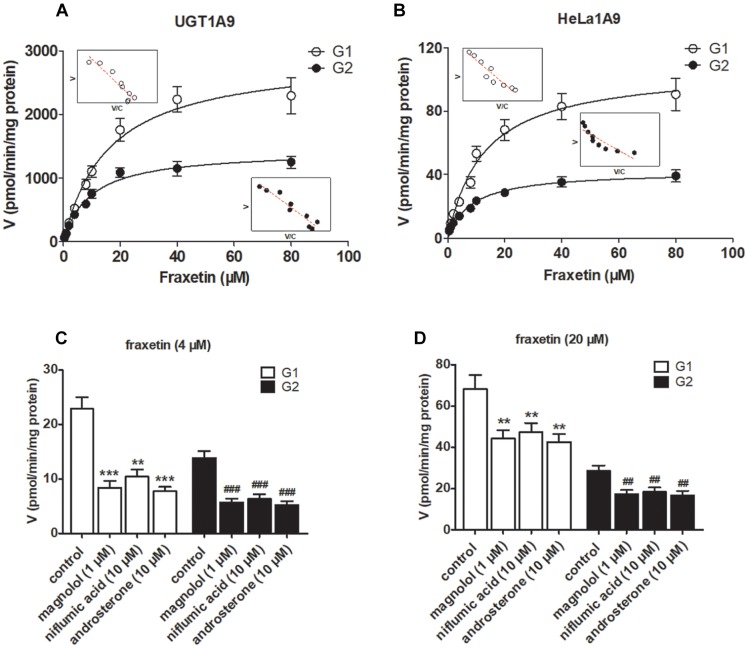
FIGURE 3.
UGT1A9 catalyzes the glucuronidation of fraxetin. (A) Kinetic profiles for fraxetin-8-O-glucuronide (G1) and fraxetin-7-O-glucuronide (G2; 0.5–80 μM) generated by UGT1A9. (B) kinetic profiles for G1 and G2 (0.5–80 μM) generated by the HeLa1A9 cell lysate; in each panel, the inset shows the corresponding Eadie–Hofstee plot. (C) Inhibitory effects of magnolol (1 μM), niflumic acid (10 μM), and androsterone (10 μM) on the glucuronidation (formation of G1 and G2) at 4 μM of fraxetin. (D) Inhibitory effects of magnolol (1 μM), niflumic acid (10 μM), and androsterone (10 μM) on fraxetin-O-glucuronidation (formation of G1 and G2) at 20 μM. Data are expressed as mean ± SD. ∗∗,##p < 0.01, or ∗∗∗,###p < 0.001 as compared with the control.

